Real-Time Log Monitoring with Watchlog
Monitoring Tool
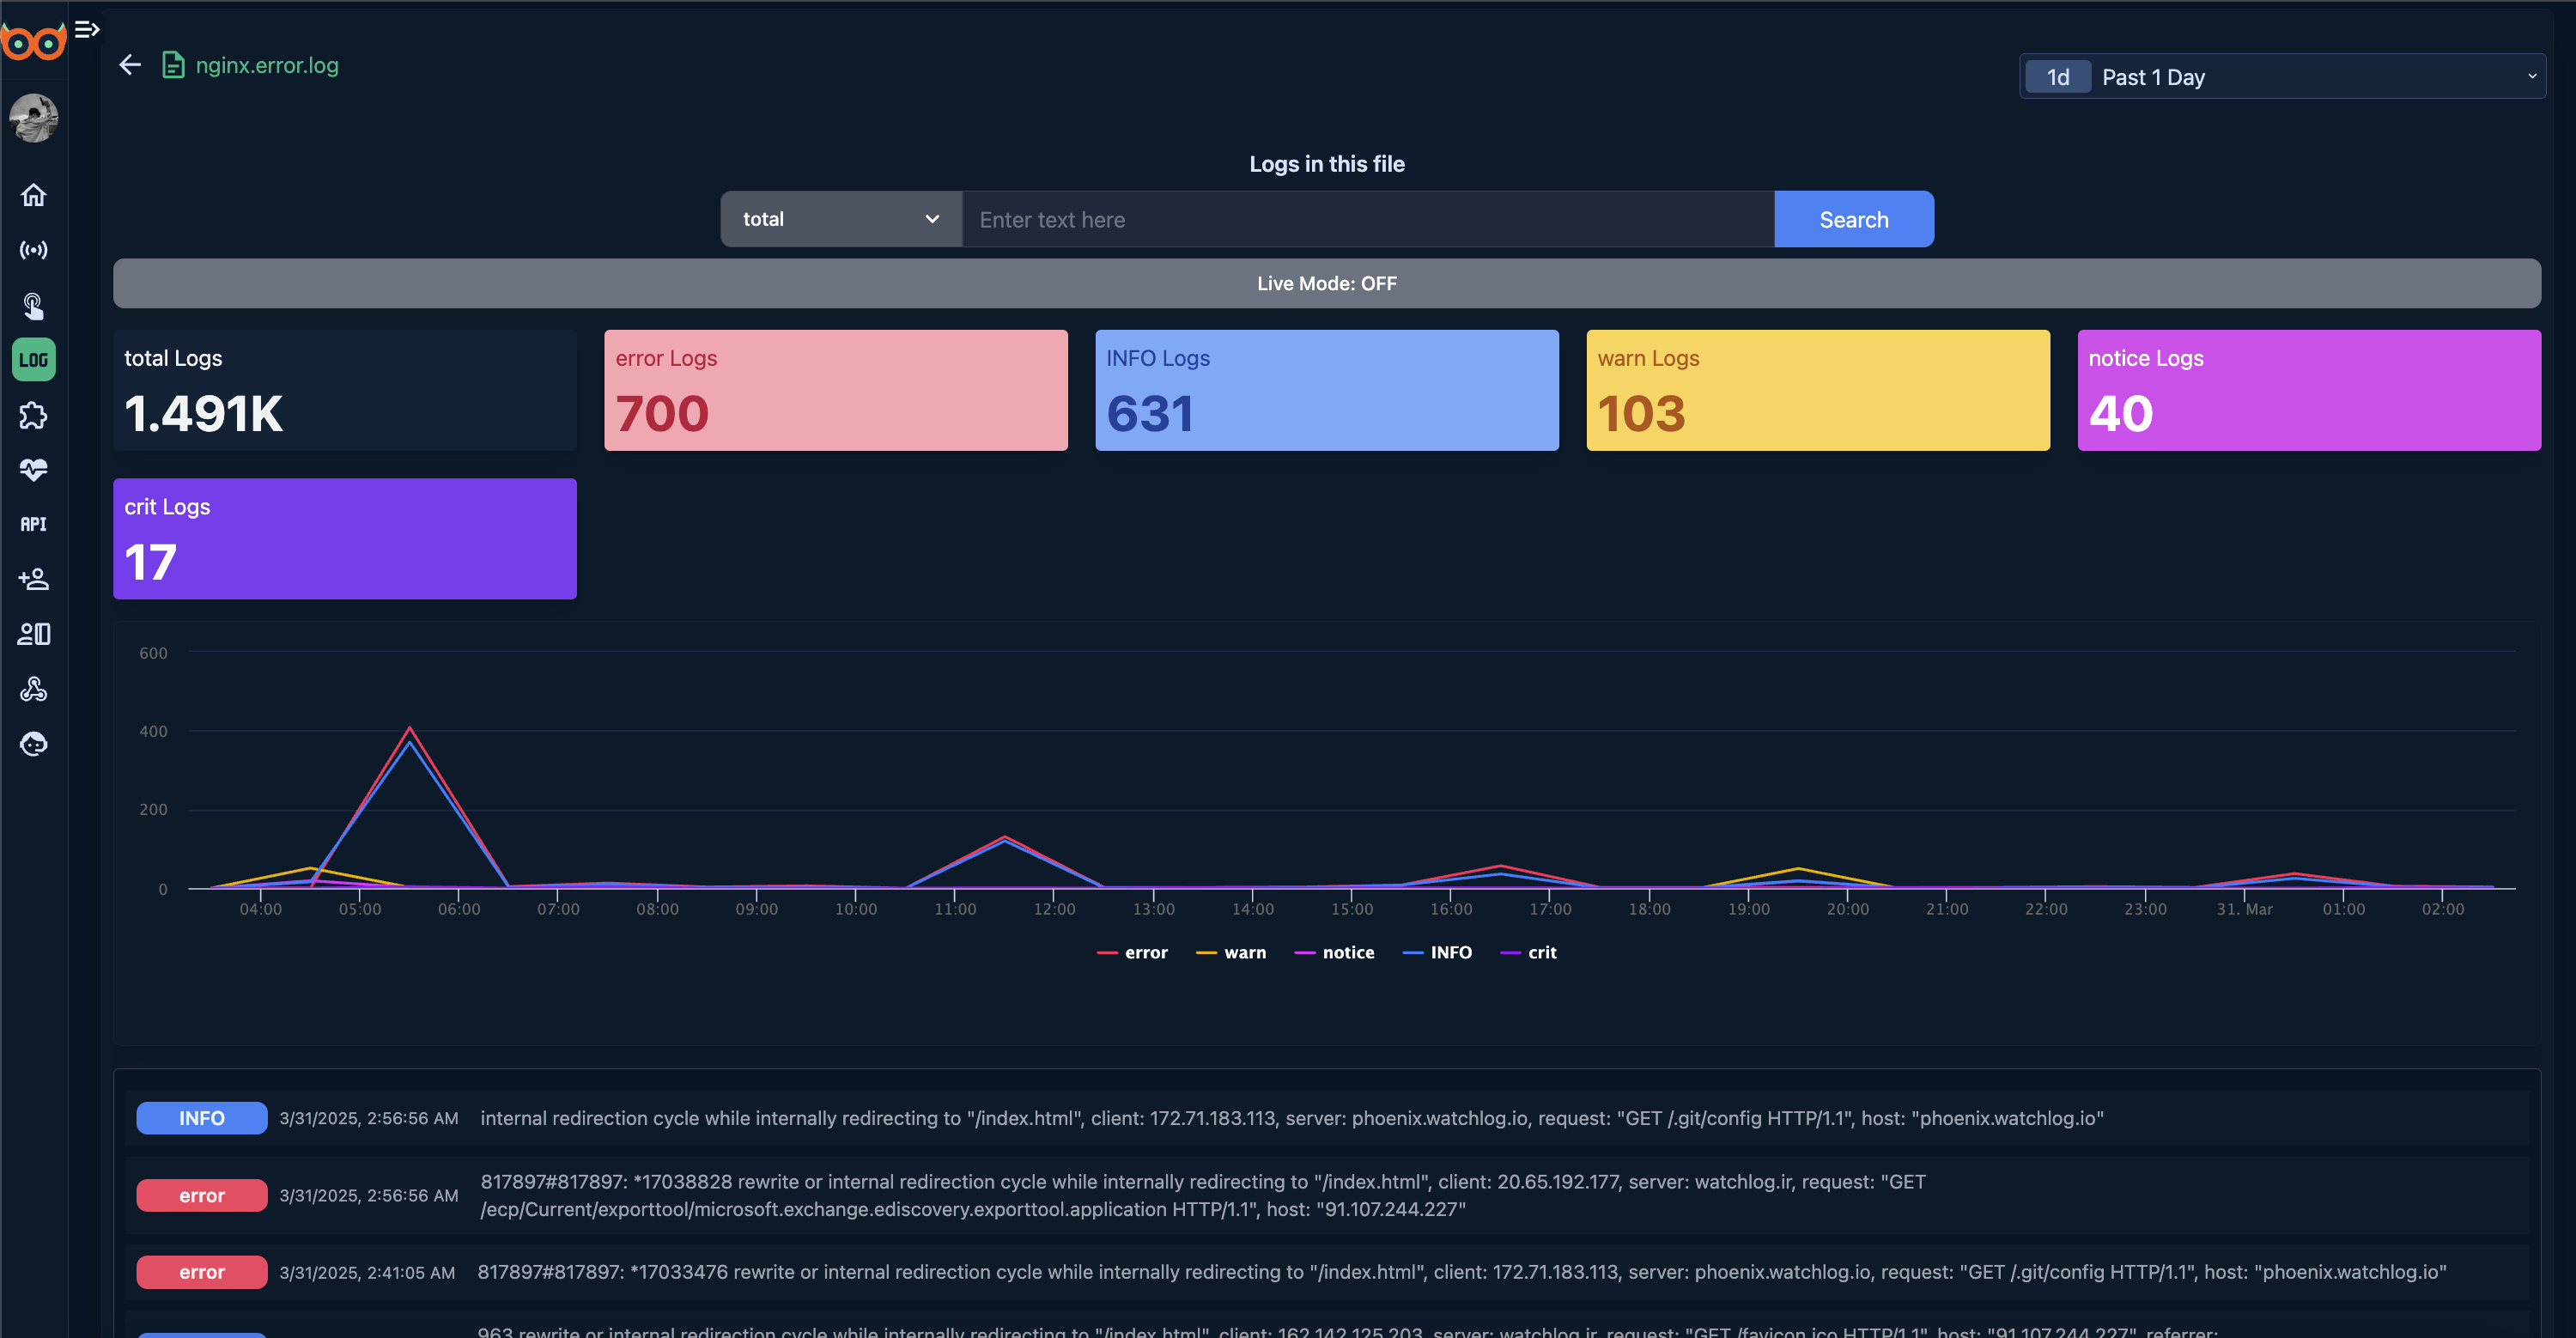
Live, Categorized Log Visualization
Once you connect your log file, Watchlog provides a rich and structured display of its contents, including:
- Total Logs within your selected time range
- Log level counts (error, warn, info, notice, crit)
- Time-series charts for each level
- Color-coded, real-time display of latest logs
This combination helps you pinpoint problems in just seconds.
Live Mode — Instant Updates Without Refreshing
Enable Live Mode to see new logs as they are written — instantly and automatically.
No need to run tail -f or refresh your browser. Everything updates live in the dashboard.
Smart Log Search
Need to find a specific log? Use Watchlog’s smart filtering to search by:
- Text inside the message
- Exact date or time
- Log level (e.g., show only errors or warnings)
Find the log you need in just a few clicks.
Multi-File Log Monitoring Made Easy
Monitor multiple log files from different servers at the same time.
Each log source has its own dedicated view, and you can easily switch between them from the dashboard.
Conclusion
Log Monitoring in Watchlog is a lightweight yet powerful tool for analyzing logs in real time. Whether you’re tracking down errors or observing system behavior live, Watchlog gives you full control through a fast, clean, and professional dashboard.
👉 View Log Monitoring Documentation
Start Monitoring in Under 2 Minutes
Our documentation will guide you through adding your log files to Watchlog in just a few simple steps.