1. Access API Monitors
Visit the API Monitors section in your Watchlog dashboard to get started.
2. Define and Configure Your API Monitor
Set up periodic health checks by providing the details of the API you want to monitor.
- Click New Monitor and enter the full
Endpoint URLof your API (e.g.,https://api.example.com/health). - Choose how often to run checks under
Interval(default is every 5 minutes). - (Optional) Under
Request Settings, add custom headers or authentication tokens to simulate real traffic. - Toggle
Enabledand click Save to start automatic, continuous monitoring of the endpoint.
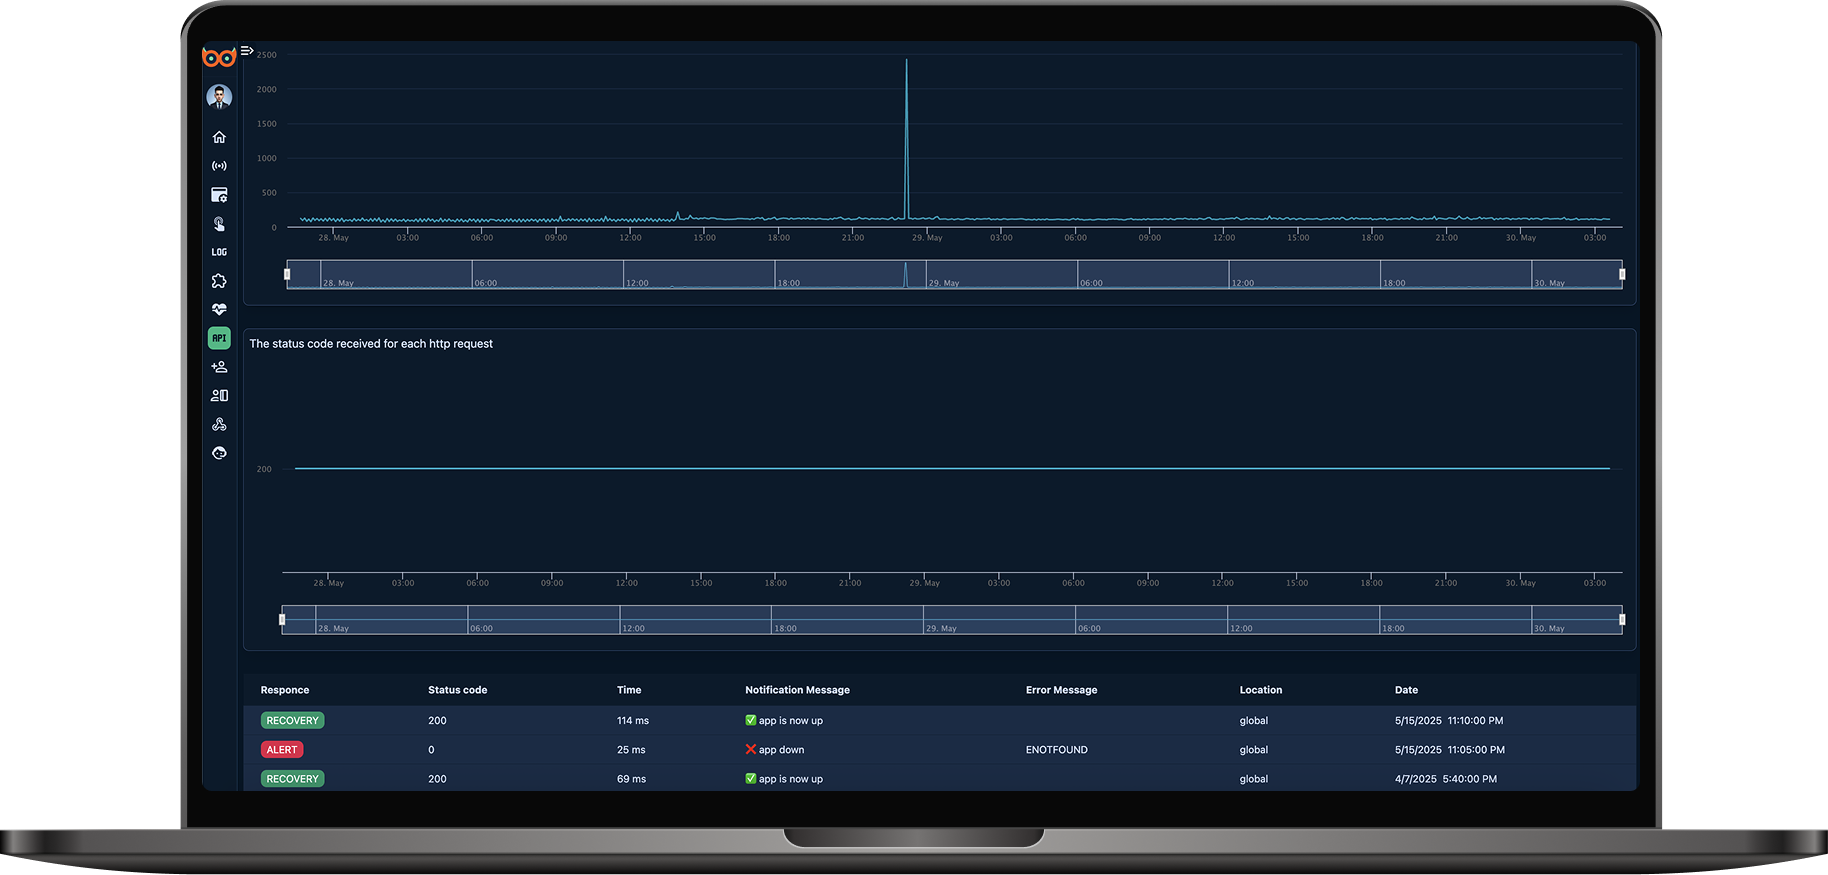
3. View Performance Charts
Status Codes
See distribution of HTTP status codes returned over time.
Response Time
Track average and percentile response times per interval.
4. Configure Alerts
Set up notifications via email or webhooks to be alerted when an API check fails or specific thresholds are breached.
5. View Error Logs
All failed checks and exceptions are logged in the dashboard. Review detailed error messages and stack traces for troubleshooting.