PostgreSQL Integration
Configure the Watchlog Agent to monitor your PostgreSQL databases, tables, and query performance.
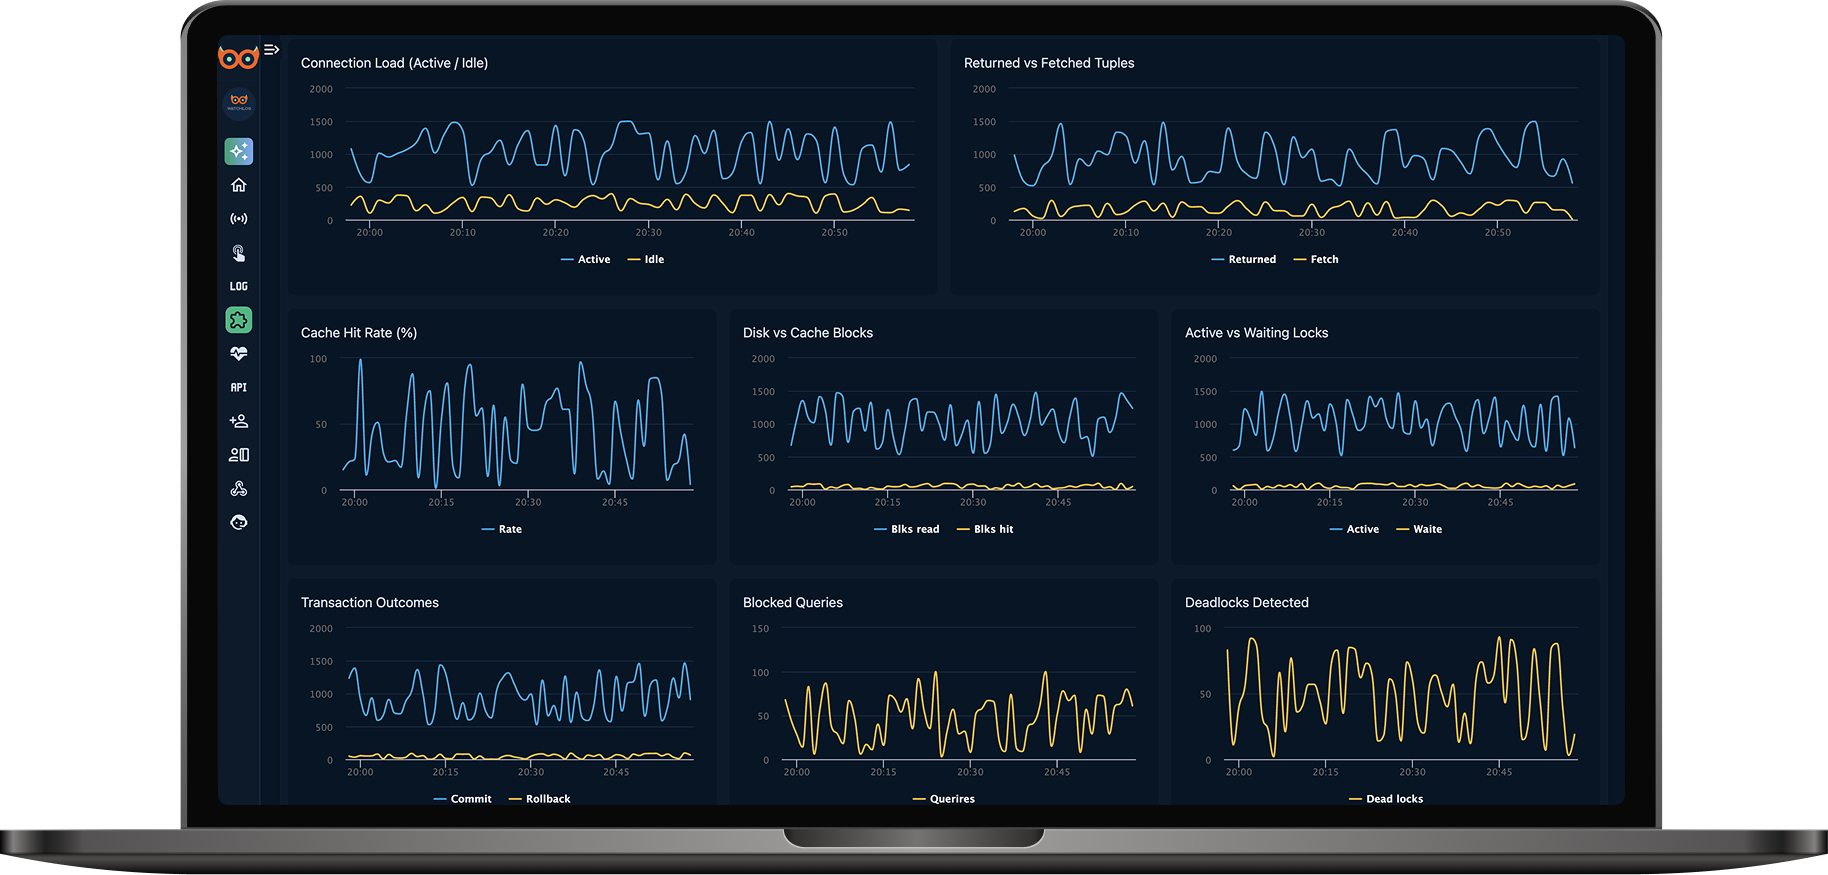
Explore PostgreSQL Monitoring Capabilities
Database Overview
Tables count, indexes count, total database size, and uptime since last restart.
Live Records
Monitor records inserted, updated, and deleted in real time.
Connection Load
Track active vs idle connections to identify bottlenecks instantly.
Cache & Disk Blocks
Cache hit rate vs disk reads to optimize memory usage and minimize I/O.
Lock & Query Analysis
Monitor active vs waiting locks, blocked queries, and deadlock incidents.
Transaction Outcomes
Track committed vs rolled back transactions for stability insights.
Tuples Stats
Compare returned vs fetched tuples to identify inefficient queries.
Query Performance
Normalized query view with count, total & average duration, and rows.
All metrics available in real time or over custom time ranges via the Watchlog dashboard.
Start Monitoring in Seconds
Configure your Postgresql integration in minutes—head to the docs for full setup instructions.
View Setup Instructions