PM2 Integration
Monitor your PM2-managed Node.js applications with Watchlog for real-time performance insights.
Explore PM2 Monitoring Capabilities
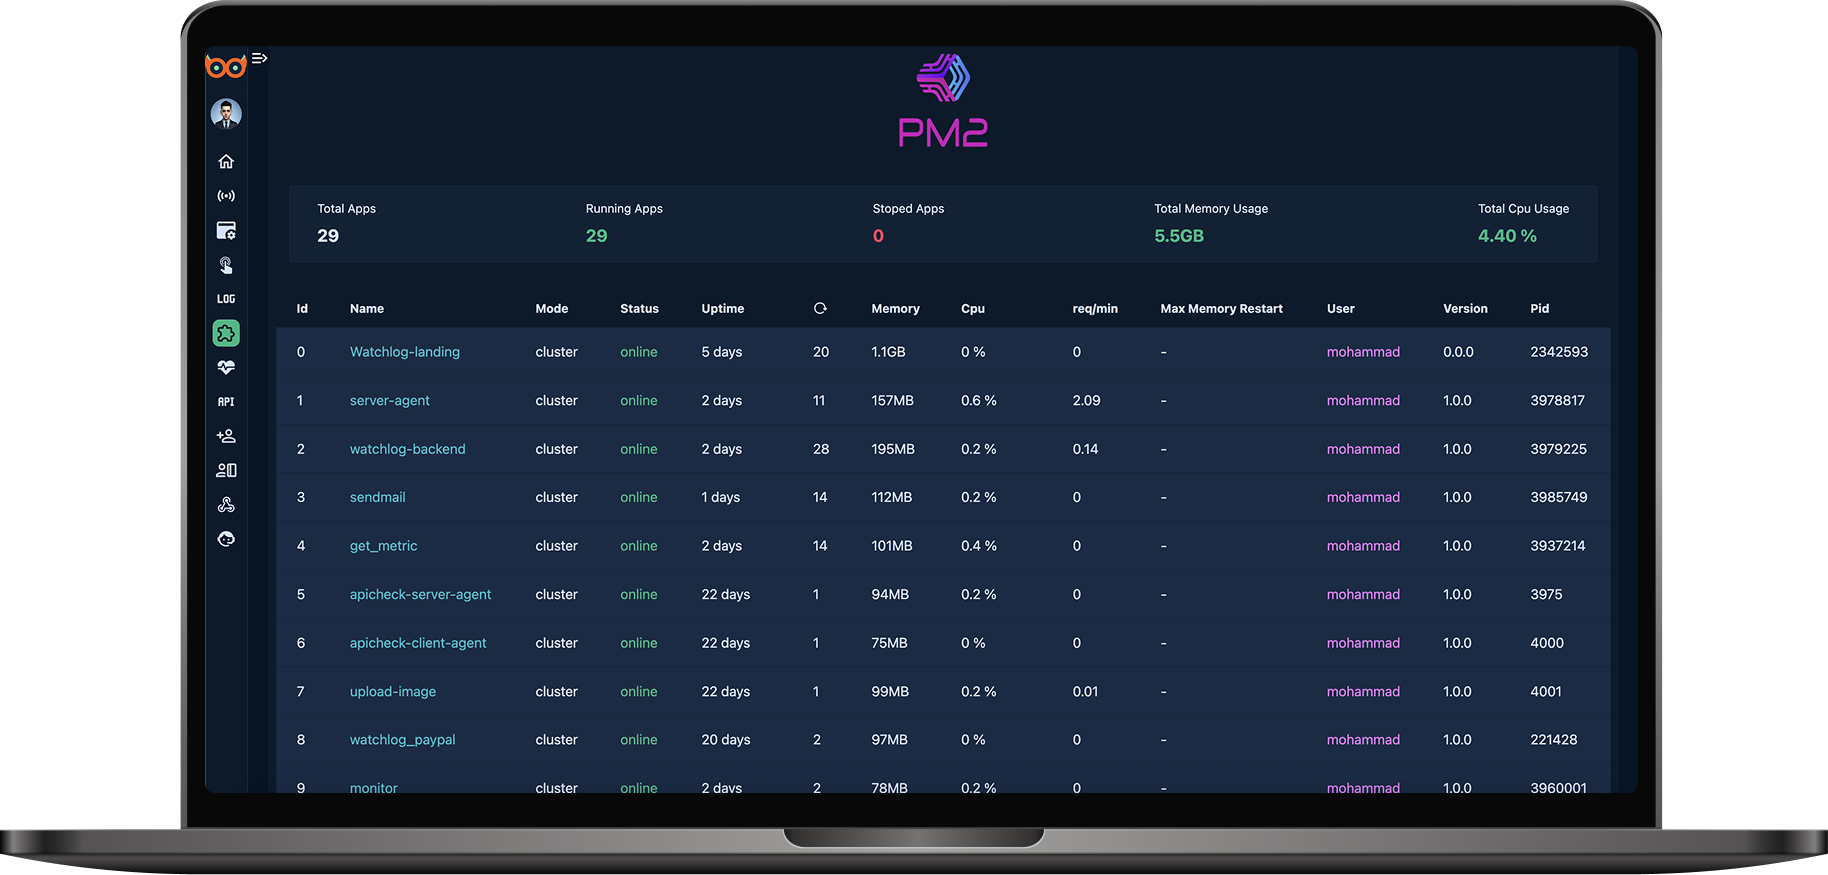
Application Name & Status
View your PM2 app names, online/offline status, and uptime.
Memory & CPU Usage
Monitor resource consumption and process IDs with real-time charts.
Version, User & PID
See the executing user, app version, and process IDs for each service.
Requests Per Minute
Interactive charts show request throughput and app load over time.
Dynamic Memory Charts
Real-time and historical memory usage with thresholds and caps.
CPU Usage Trends
Analyze CPU load trends to pinpoint unoptimized processes and scaling needs.
All metrics available in real time or over custom time ranges via the Watchlog dashboard.
Start Monitoring in Seconds
Configure your Pm2 integration in minutes—head to the docs for full setup instructions.
View Setup Instructions