MongoDB Integration
Configure the Watchlog Agent to monitor your MongoDB instance in real time or over custom time ranges.
Deep Dive into MongoDB Performance Metrics
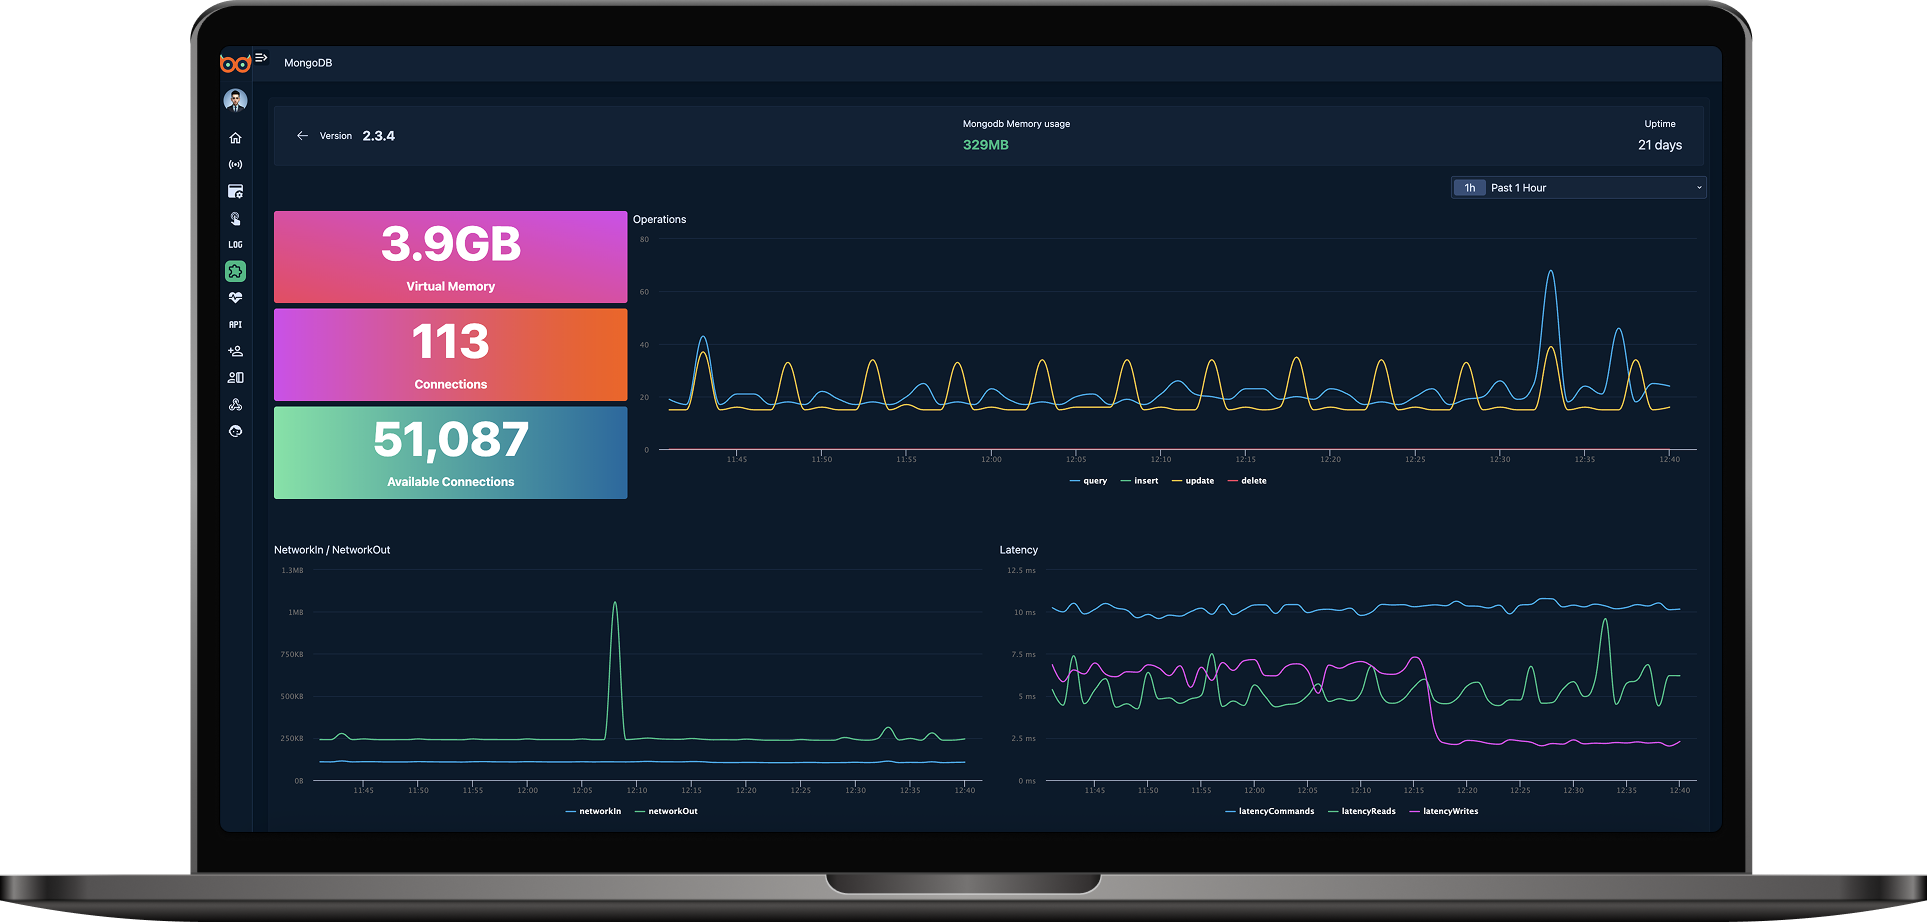
Virtual Memory
Track the total virtual memory usage of your MongoDB server, including swap and paging.
Connections
Monitor the current number of active connections to your MongoDB instance.
Available Connections
See how many connections your server can still accept before reaching the limit.
Operations
Visualize CRUD operation rates (inserts, queries, updates, deletes) in real time.
Network In/Out
Measure data throughput for incoming and outgoing network traffic.
Latency
Monitor average and maximum response times for database requests.
Memory Usage
View resident memory (RSS) and working set sizes of the MongoDB process.
Network Requests
Track the number of network commands sent to your MongoDB server.
Uptime
Monitor how long your MongoDB server has been running continuously.
Metrics are available in real time or over custom time ranges via the Watchlog dashboard.
Start Monitoring in Seconds
Configure your Mongodb integration in minutes—head to the docs for full setup instructions.
View Setup Instructions