Dedicated Infrastructure
Your own isolated Watchlog instance on dedicated servers, fully managed by us.
Watchlog is the complete observability command center for modern engineering teams. Logs, metrics, traces, uptime, APM, RUM — unified in one platform.
A short cinematic look at how signals flow through Watchlog — from infrastructure and logs to APM, RUM, and AI-powered root cause.
Servers go offline at 3am.
Your team finds out from customers.
APIs slow down.
Metrics stay silent.
Log volumes explode.
Signal drowns in noise.
Frontend users suffer.
Backend engineers are blind.
Databases degrade silently.
Until they don't.
Containers restart in loops.
No one investigates why.
Teams discover incidents hours too late.
The damage is already done.
You built a complex system.
You deserve full-stack visibility.
From infrastructure to frontend, from logs to AI-powered root cause — Watchlog captures every layer of your stack.
Ten purpose-built modules. One unified platform. Zero blind spots.
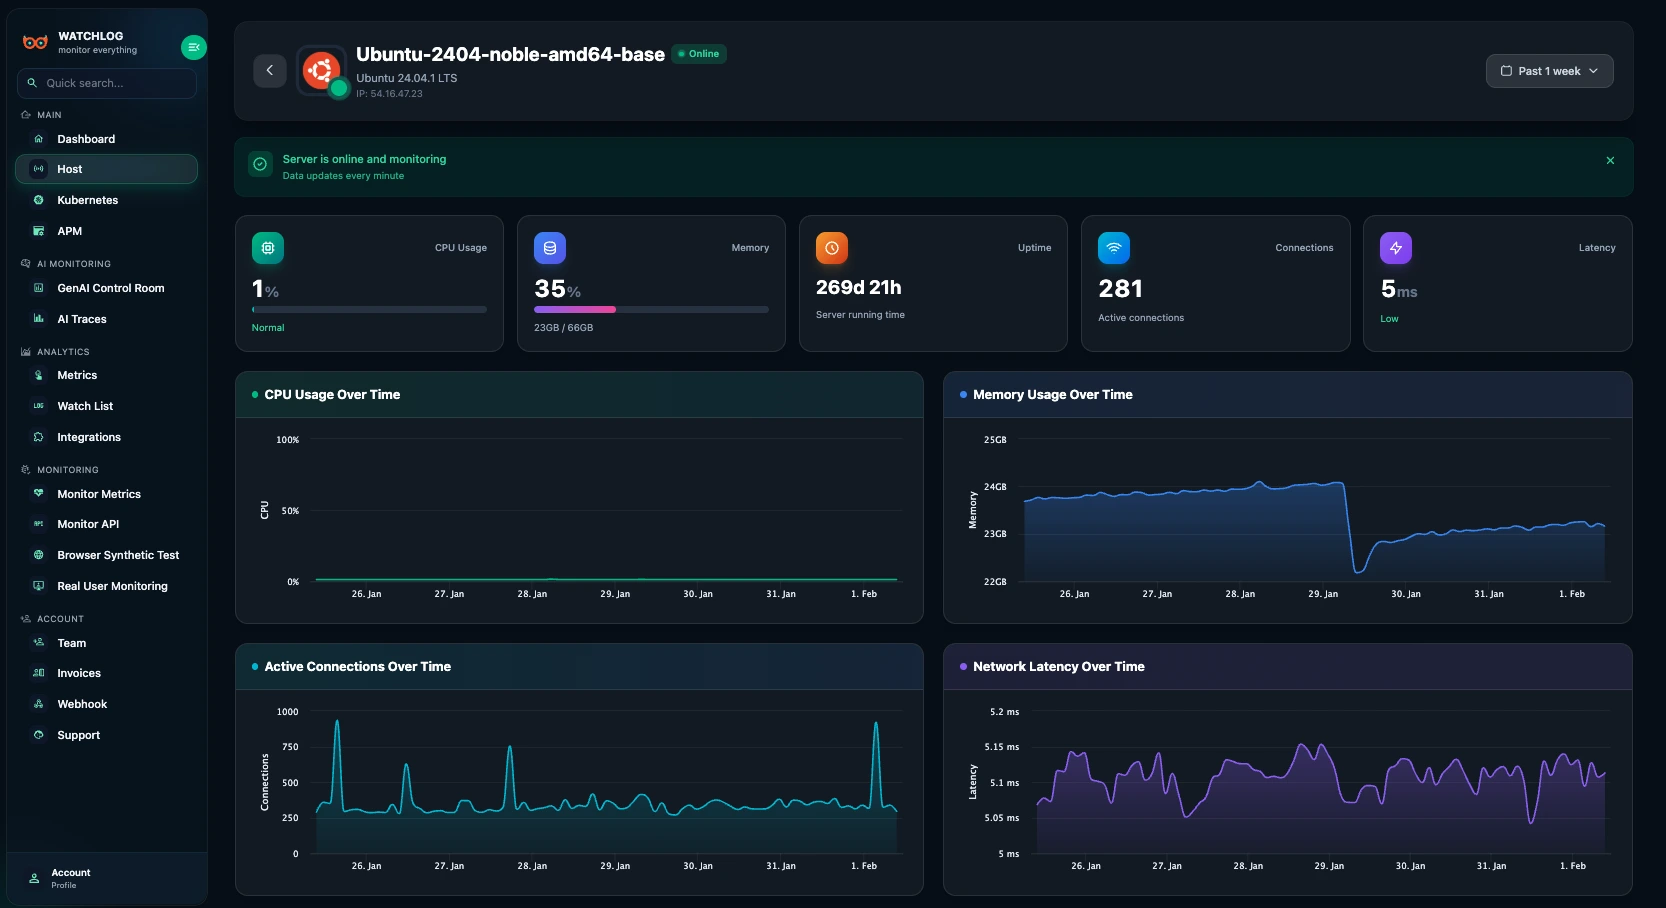
Real-time visibility into server health, resource usage, and process performance. Know exactly what every host is doing at any moment.
Ready to see your whole stack in one place?
Purpose-built for full-stack visibility. No extra tools. No fragmented dashboards.
| Feature | Watchlog | Datadog | New Relic | Grafana | Elastic | Prometheus |
|---|---|---|---|---|---|---|
| Unified platform (infra + logs + APM + RUM + AI) | ✓ | ✓ | ✓ | DIY | Partial | Metrics only |
| Setup time | ~30s agent | Hours | Hours | Days | Days | Days |
| Fully managed (no self-host) | ✓ | ✓ | ✓ | Self-host* | Self-host* | ✗ |
| Automatic discovery & integration detection | ✓ | Partial | Partial | ✗ | ✗ | ✗ |
| AI incident analysis | ✓ | Add-on | Add-on | ✗ | Partial | ✗ |
| Predictable flat pricing | ✓ | Usage $$$ | Usage $$$ | Infra cost | Infra cost | Infra cost |
| Dedicated / white-label enterprise | ✓ | ✗ | ✗ | Self-host | Self-host | ✗ |
| Open-source integrations (MongoDB, Redis, NGINX, Docker, PM2…) | ✓ | ✓ | ✓ | ✓ | ✓ | Exporters |
* requires self-hosted infrastructure
Full-stack coverage without the enterprise complexity or price tag.
Go beyond ping checks. Monitor every layer of your application.
No Grafana configs. No Prometheus setup. Just connect and monitor.
Free to start. No credit card required.
QUICK START
1# Install Watchlog agent
2sudo apiKey="$WATCHLOG_API_KEY" server="$WATCHLOG_SERVER" MEMORY="300M" bash -c "$(curl -L https://watchlog.io/ubuntu/watchlog-script.sh)"
3
4# Check agent status
5pm2 statusNative integrations with the tools modern engineering teams rely on.
Watchlog automates the journey from data collection to incident resolution.
Ingest metrics, logs, traces, and events from every layer of your stack.
Intelligent alerting surfaces anomalies before they become incidents.
Connect signals across services, hosts, and time windows automatically.
AI-powered root cause analysis with full context and recommendations.
Notify your team via Slack, PagerDuty, webhooks, Telegram, or email.
Close the loop. Track MTTR. Learn from every incident.
Memory leak in auth-service pod (3 of 5 replicas affected)
Scale auth-service replicas. Check for unbounded cache growth.
Connects logs, metrics, traces, and process data across your entire stack simultaneously.
Identifies the most probable cause of an incident with confidence scoring and evidence links.
Suggests specific remediation steps based on historical patterns and system context.
Reduces mean time to resolution by surfacing relevant signals automatically.
Watchlog AI works across all your monitoring data — infrastructure, applications, databases, and custom signals.
Watchlog Enterprise gives your organization a private, fully managed observability platform — provisioned, branded, and supported as your own.
Your own isolated Watchlog instance on dedicated servers, fully managed by us.
Run Watchlog on your own subdomain or domain.
Your company logo and branding across the entire interface.
Add your whole organization with admin-managed access.
We provision, configure, deploy, and maintain everything.
Direct, prioritized support for your team.
Watchlog replaced three separate tools we were using. APM, log monitoring, and uptime — all in one place. Our on-call rotations became significantly less painful.
The AI incident analysis is genuinely useful. It doesn't just summarize — it actually pinpoints the service and recommends what to check first.
We moved from a self-hosted Grafana setup to Watchlog in a week. The time savings on maintenance alone paid for the subscription.
RUM and APM in one dashboard changed how we debug production issues. We can trace from the user's browser all the way to the database query.
The Kubernetes monitoring is solid. We can see every pod, restart event, and resource usage without setting up a bunch of exporters.
Enterprise deployment was smooth. Our own domain, our own data, our own branding. Watchlog handled the infrastructure side completely.
Trusted by teams at startups, scale-ups, and enterprise organizations worldwide.
Watchlog is a full-stack observability platform that unifies infrastructure monitoring, log management, APM, RUM, API monitoring, synthetic testing, and AI-powered incident analysis in a single platform. It's built for engineering teams that need complete visibility without managing multiple tools.
Yes. Watchlog APM provides distributed tracing, error tracking, service maps, and response time analysis. It supports Node.js, Python, PHP, and other popular runtimes with automatic instrumentation.
Yes. Watchlog RUM captures real user sessions, page load performance, Core Web Vitals, and JavaScript errors in production. It integrates with your frontend via a lightweight SDK.
Yes. Watchlog has native support for Docker containers and Kubernetes clusters. You can monitor pods, nodes, namespaces, resource usage, and restart events with no additional exporters.
Watchlog supports MongoDB, Redis, MySQL, PostgreSQL, and more. It monitors query performance, connection pools, slow queries, and database-specific metrics.
Yes. Watchlog supports webhooks, Slack, Telegram, email, and PagerDuty for alert notifications. You can configure routing rules, escalation policies, and quiet hours per team.
Yes. Watchlog Enterprise includes a dedicated server, custom domain, company branding, team management, and managed infrastructure. Your data stays on your own isolated instance.
For infrastructure and host monitoring, yes — a lightweight Watchlog agent runs on your servers. For APM and RUM, you integrate via SDK. For API monitoring and synthetic tests, no agent is required — Watchlog probes from external locations.
Most teams are up and running in under 30 minutes. The agent installs in minutes, and the SDKs have minimal configuration. Enterprise deployments typically take 1-2 business days.
Watchlog offers transparent plans based on the number of hosts, log volume, and features. There's a free tier for getting started. Enterprise plans are custom-quoted based on your needs.
Join engineering teams that chose full-stack visibility over fragmented tools.