Watchlist - Custom Log Monitoring
Track any HTTP endpoint—GET, POST, PUT, DELETE—with custom headers and bodies. Monitor any log file in real time by defining custom watchlists and parsing rules.
Get Started For FreeKey Watchlist Features
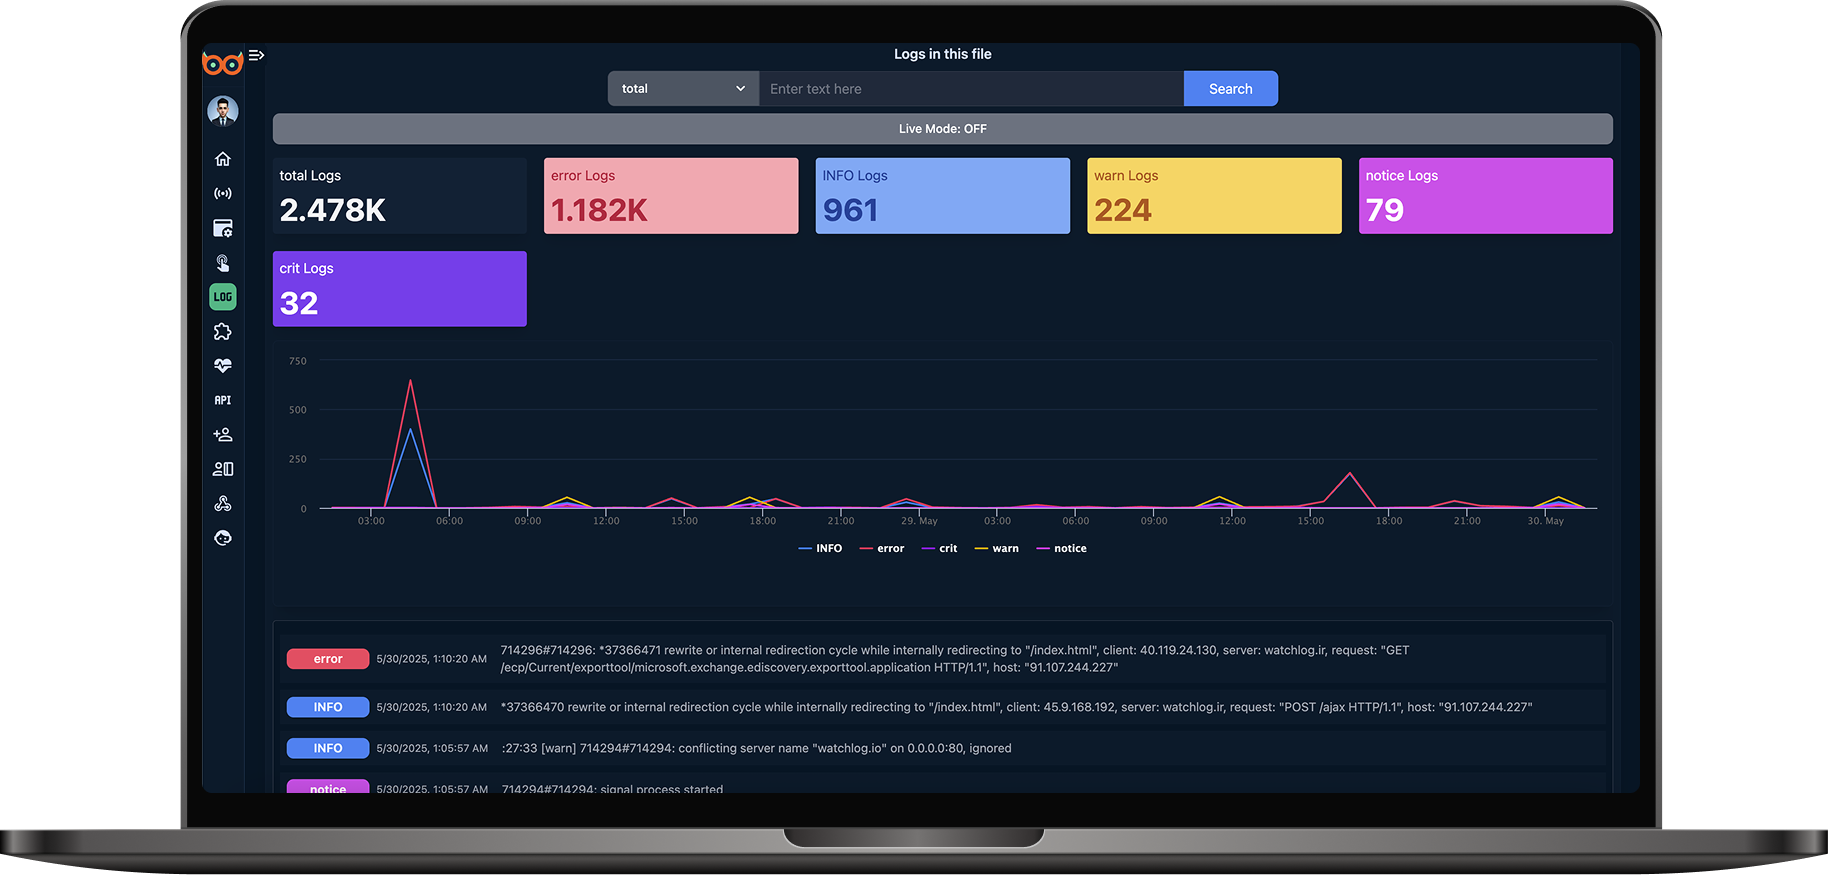
Search Logs
Quickly find entries by keyword across all monitored logs in real time.
Filter by Levels & Time
Apply filters by log level or custom date ranges for focused analysis.
Live Mode
Enable real-time updates to watch incoming log entries without refreshing.
Interactive Charts
Visualize log volume and level distribution with dynamic charts.
Level Parsing
Automatically detect and categorize levels or define custom patterns.
Start Monitoring in Seconds
Add your endpoint, configure your check interval, and see your API health instantly.
View Setup Instructions