Redis Integration
Configure the Watchlog Agent to monitor your Redis instance and gain deep insights into cache performance.
Deep Dive into Redis Monitoring Capabilities
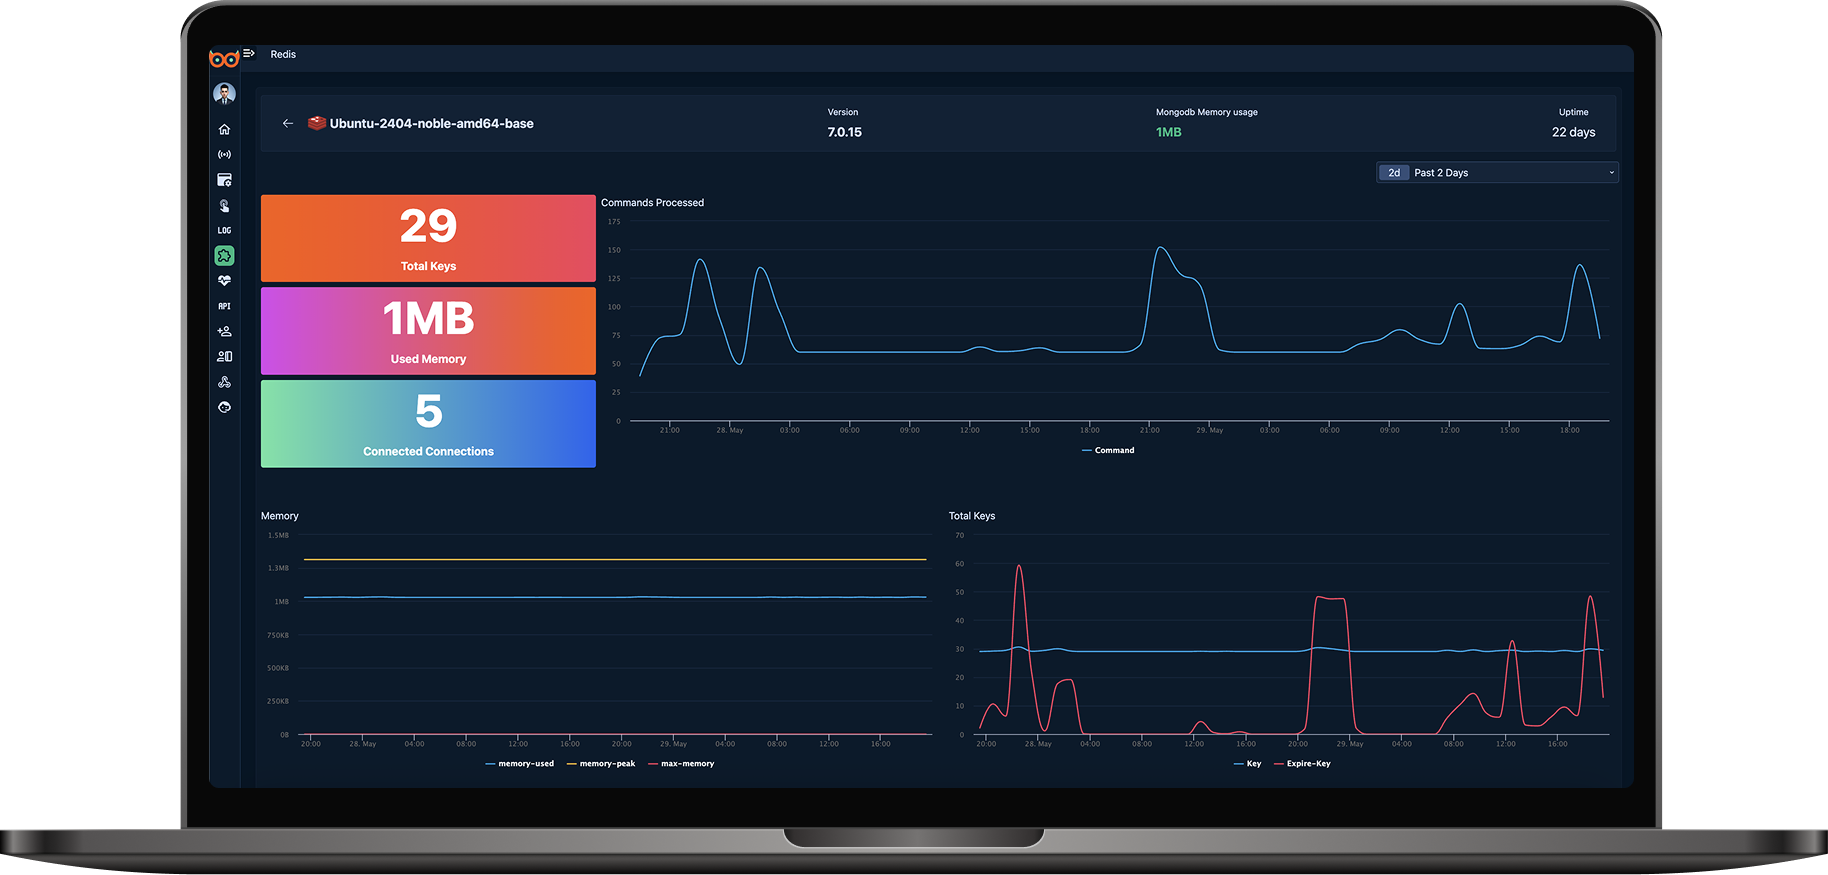
Commands Processed
Track the total number of processed Redis commands to gauge server load.
Memory Usage
See used, peak, and max memory to avoid OOM errors and optimize usage.
Total Keys
Monitor total and expiring keys to manage data growth effectively.
Network I/O
View input and output traffic for distributed systems performance.
Pub/Sub Channels
Monitor active channels and patterns for real-time messaging scale.
Keyspace Hits & Misses
Track cache efficiency by comparing hits versus misses.
All metrics available in real time or over custom time ranges via the Watchlog dashboard.
Start Monitoring in Seconds
Configure your Redis integration in minutes—head to the docs for full setup instructions.
View Setup Instructions