Powerful APM Dashboard Built for Django
Watchlog visualizes every request, query, and error with clean dashboards and instant feedback.
Why APM for Django?
Most developers don’t realize how slow or error-prone their Django apps are until users complain. With Watchlog APM, you get immediate insights into what's slowing you down — no setup, no guesswork.
Track route performance
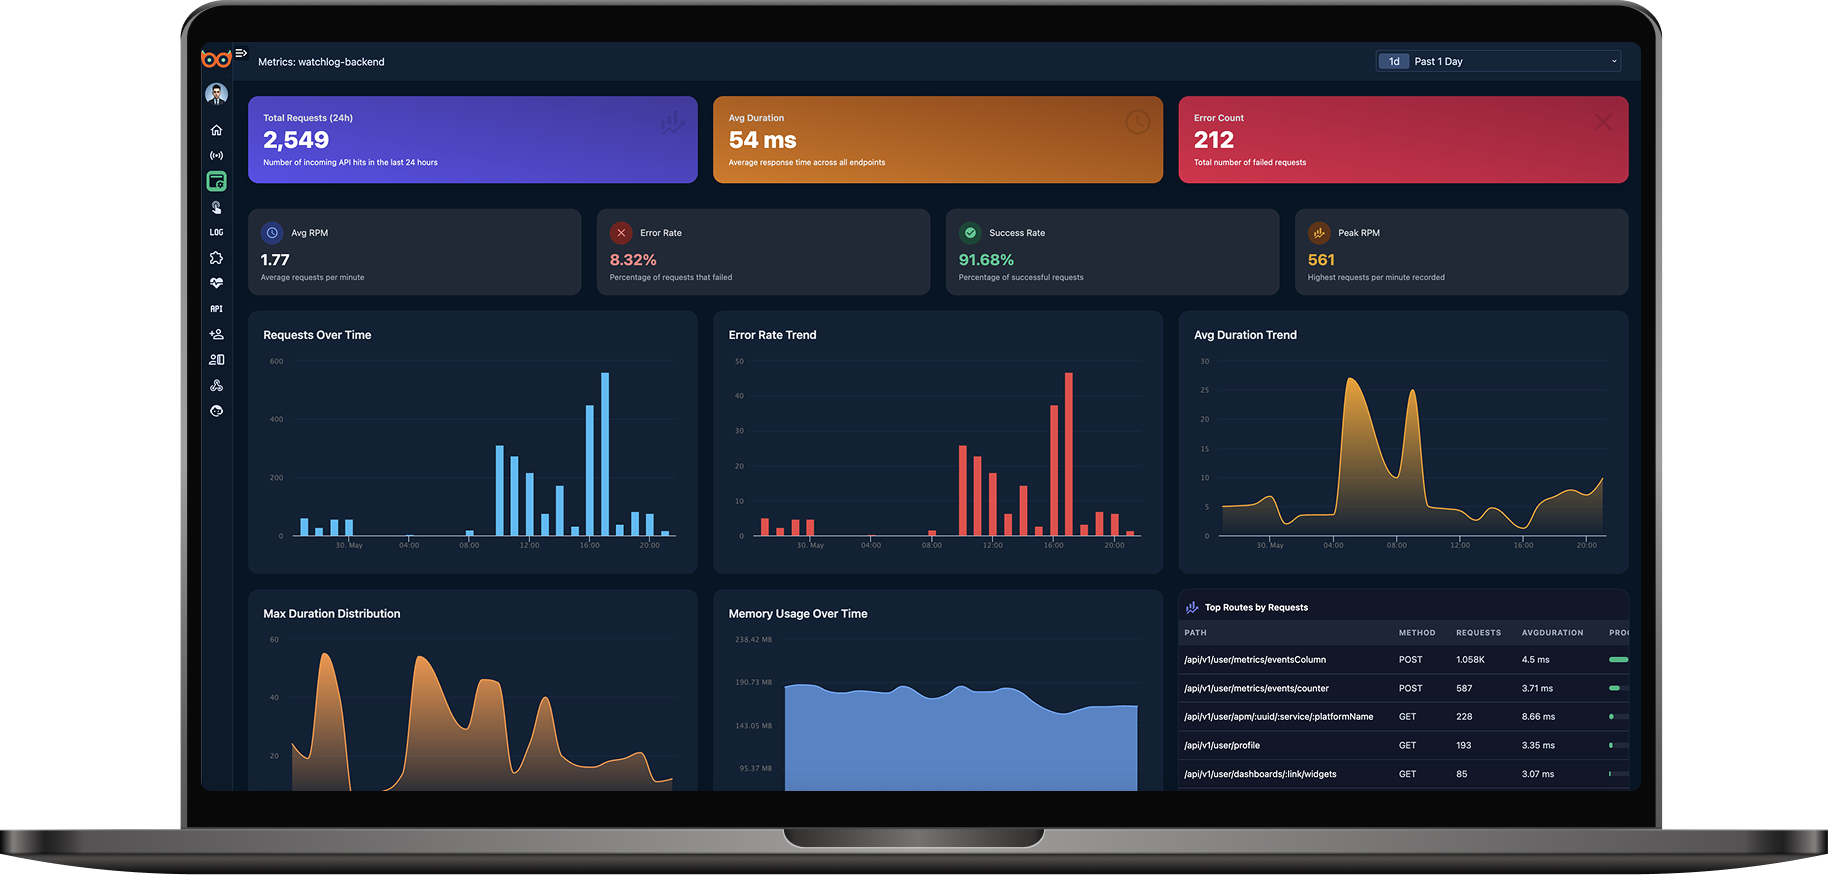
See average and max duration for every endpoint
Monitor errors in real-time
Group exceptions by file, view, and type
Analyze query trends over time
Visualize database performance and query patterns
Lightweight, low-overhead
Built for production—adds almost zero latency
Built for Django Developers
Watchlog APM for Django gives you full-stack visibility into your application performance. Track route duration, query counts, memory usage, and top bottlenecks. Watchlog automatically instruments your Django app out of the box.
Start Monitoring Your Django App Today
No setup. No config. Just install the package and see everything.
Start Free TrialActivate Django APM in 3 Easy Steps
Install Watchlog Agent
Deploy the Watchlog agent on your server with one simple command.
Install APM Package
Run pip install django-watchlog-apm in your Django project.
Start Your App
Run your server and start seeing live metrics instantly in your dashboard.