
Watch GitLab CI/CD health — in one dashboard
Monitor pipeline success rate, lead time, queue duration, runner availability, merge requests, and job-level details. Spot delivery bottlenecks early and keep your deployment flow reliable.
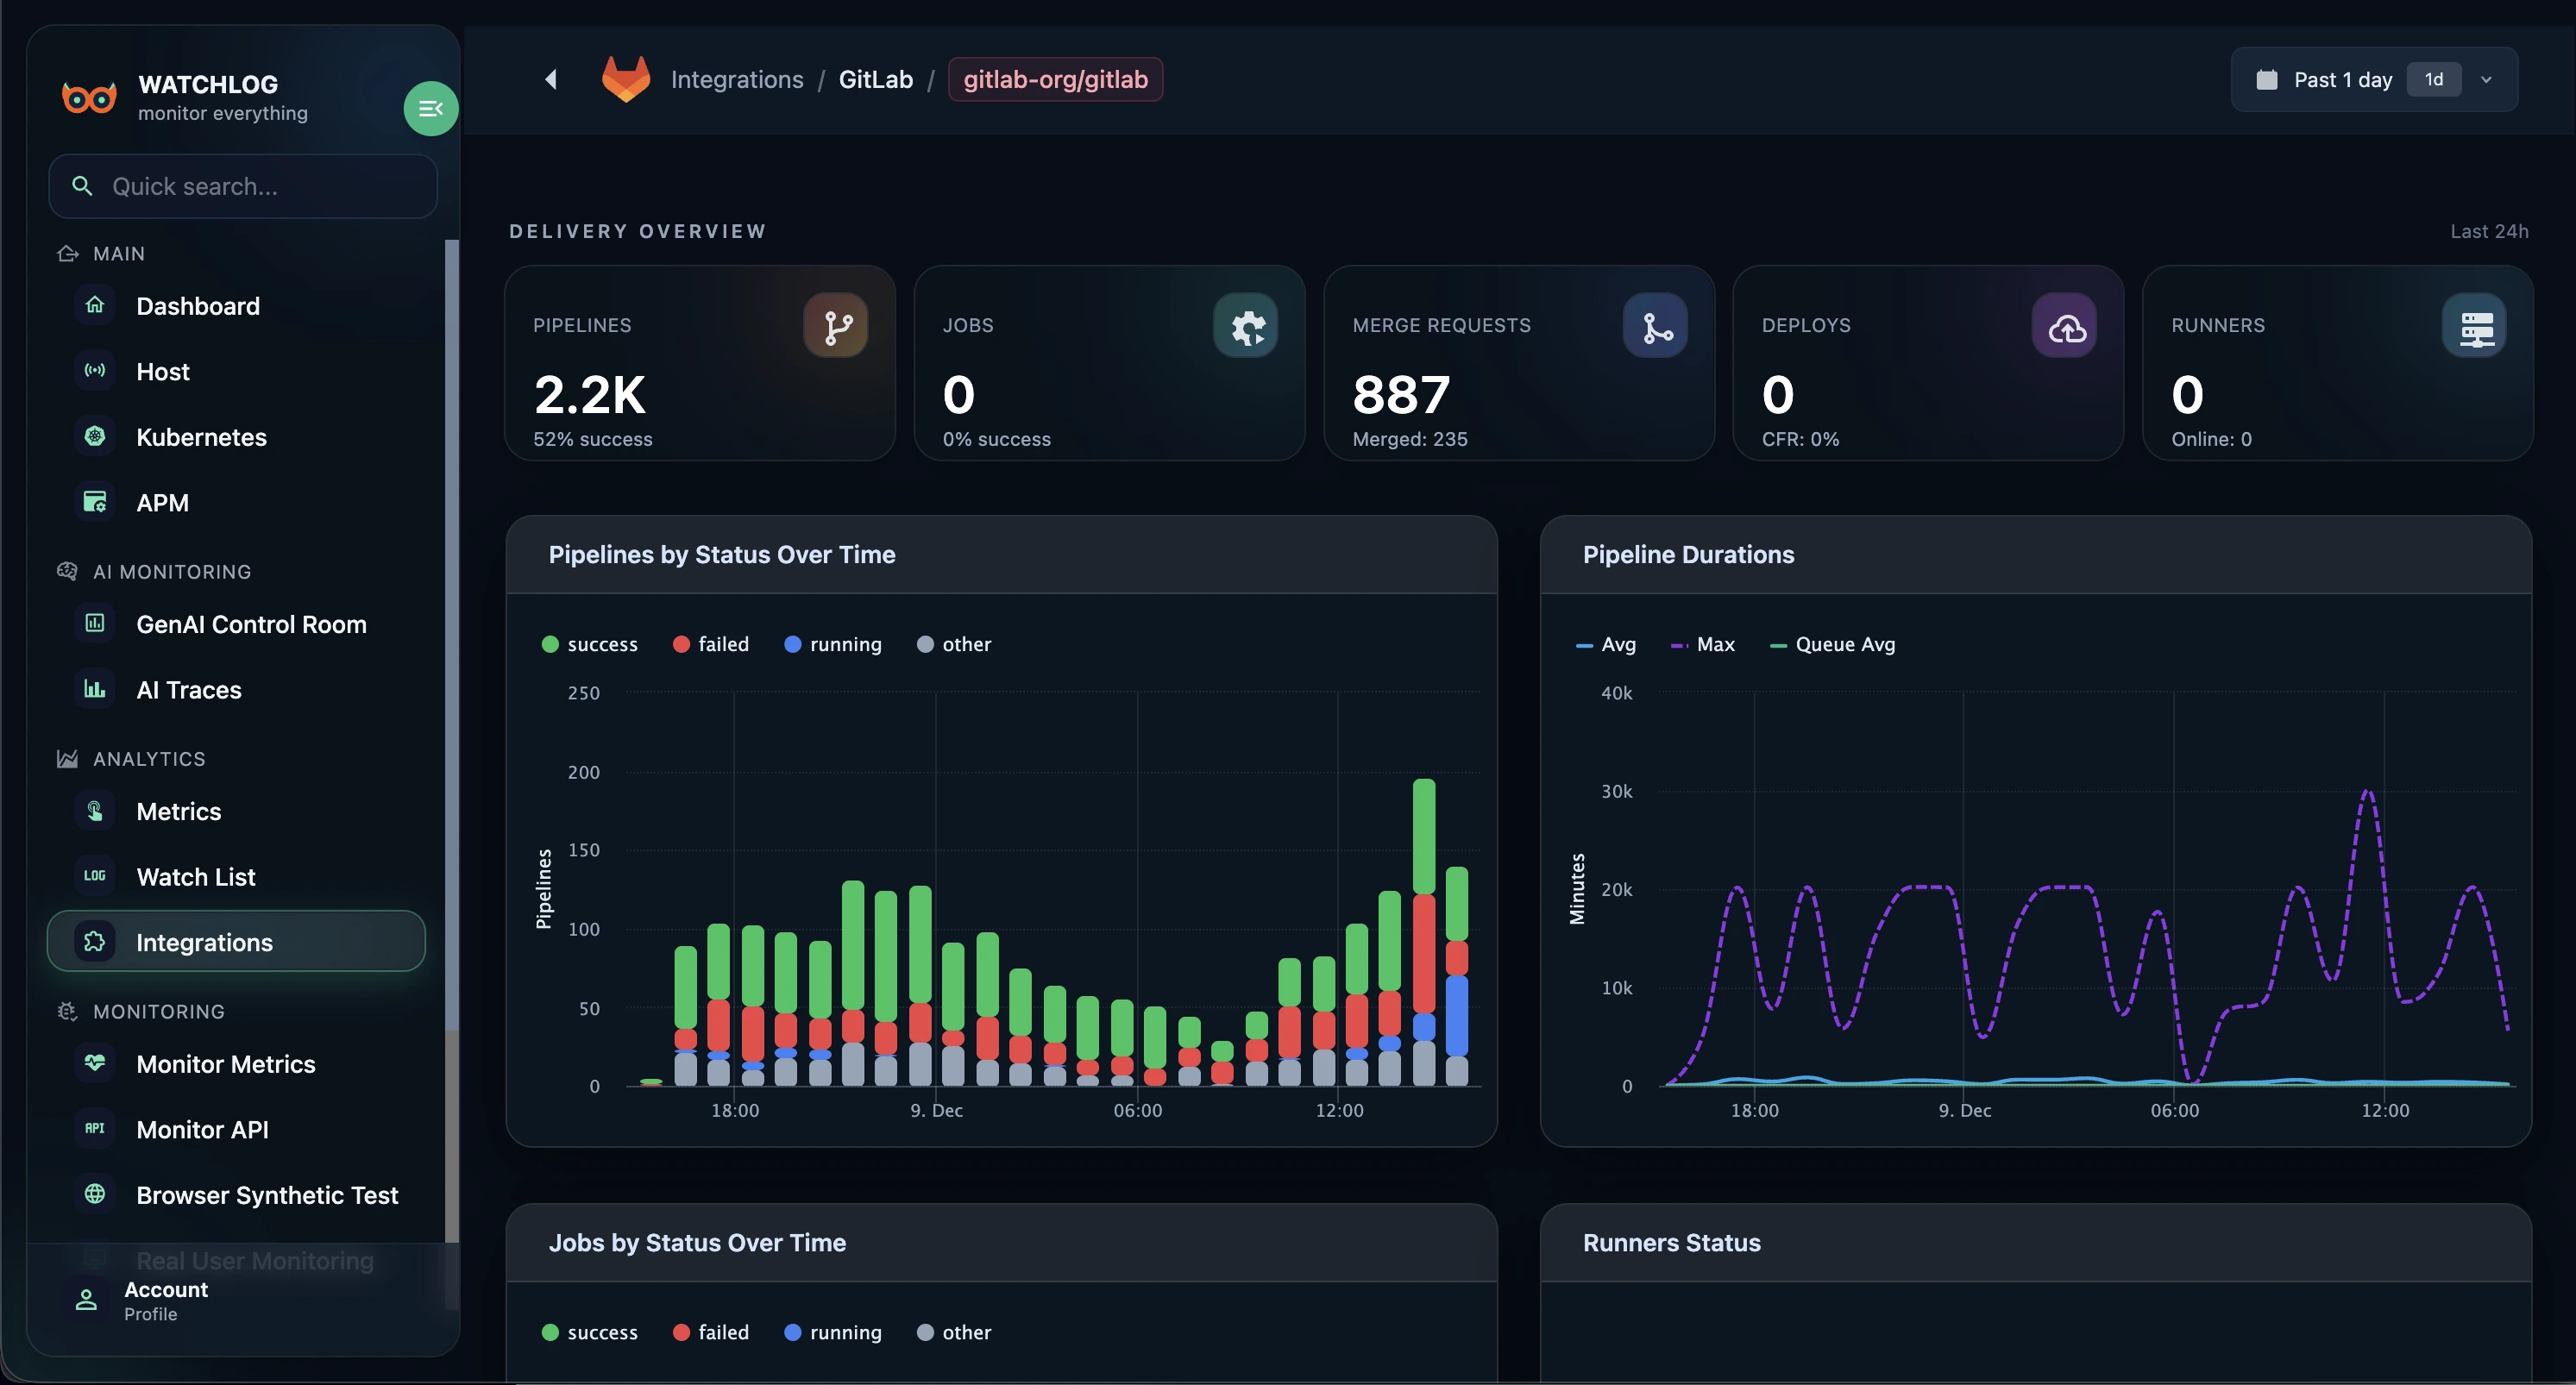
GitLab dashboard overview
See pipelines, jobs, merge requests, deployments, and runner health in one unified view — so you can assess delivery performance in seconds.
What we monitor for you
Delivery overview
A clear summary of pipelines, jobs, merge requests, deployments, and runners — across any selected time range.
Pipeline status over time
Track trends for success, failed, canceled, skipped, and running pipelines to catch quality drops early.
Pipeline duration & lead time
Monitor averages, peaks, and queue impact to identify slow stages and recurring bottlenecks.
Merge request lead time
Measure time from MR creation to merge. Understand review capacity and optimize your PR workflow.
Deployment & success rate
Separate charts for pipeline and deployment success — quickly spot fragile periods in your release cycle.
Pipeline throughput
See pipelines per hour (or any range) and validate whether your DevOps capacity scales with team growth.
Queue duration & job duration
Understand how long jobs wait vs. run — detect runner shortages and CI misconfigurations fast.
Runner health
Track runner online/offline status and load, and understand their impact on queue times.
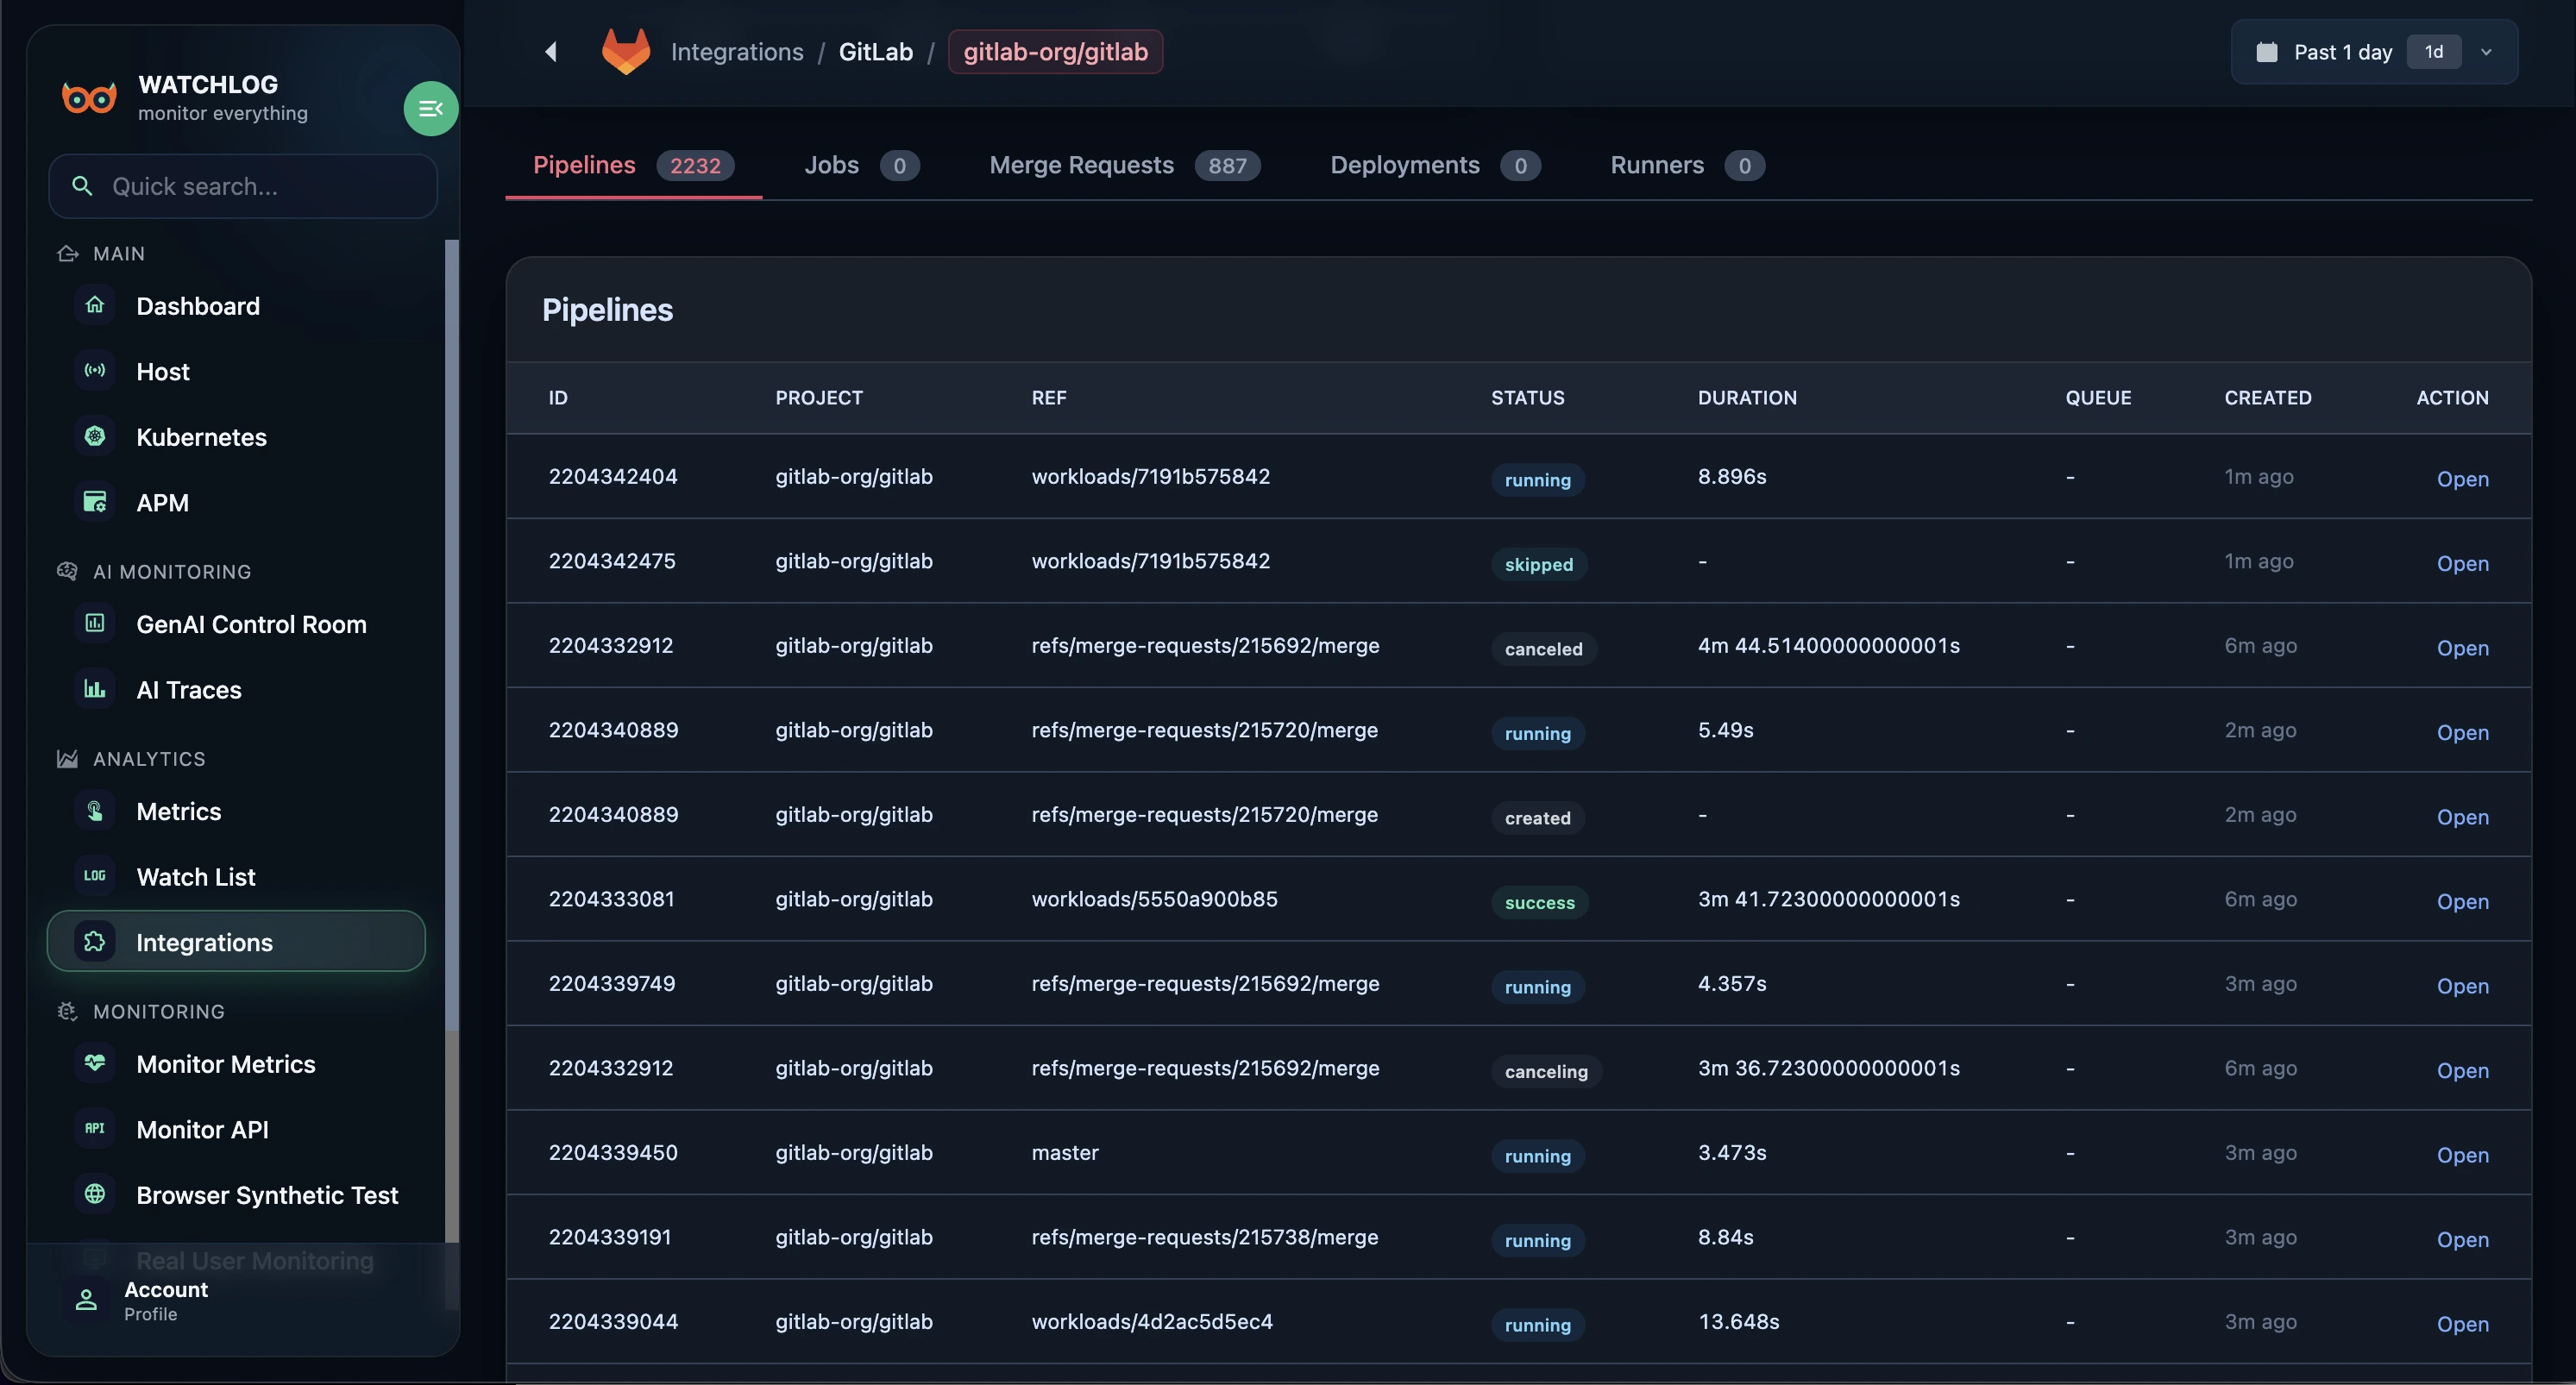
Full pipelines table
Drill down quickly with project, branch/ref, status, duration, creation time, and direct links to GitLab.
Pipeline table inside Watchlog
A complete table view of your pipelines helps you validate CI/CD health in seconds and drill down with confidence.
How the GitLab integration works
Watchlog connects via the GitLab API — no agent on runners. Provide a read-only token and Watchlog securely syncs CI/CD signals to build dashboards and alerts.
- 1
Create an access token in GitLab
Generate a Personal or Project Access Token with minimal permissions (e.g., read_api).
- 2
Configure the integration in Watchlog
Enter your GitLab URL (gitlab.com or self-hosted), paste the token, and select groups/projects to monitor.
- 3
Dashboards, alerts, and reporting
Once synced, dashboards go live. Create alerts for lead time increases, success rate drops, or longer queues.
Make delivery performance visible
Connect GitLab in minutes and stop guessing about CI/CD health. Measure, improve, and ship with confidence.
GitLab integration FAQs
Do I need to install anything on runners?
No. Watchlog reads pipeline, job, and merge request data through the GitLab API. You only need a token with minimal read-only permissions.
Do you support self-hosted GitLab?
Yes. Enter your internal GitLab URL and make sure Watchlog can reach it over the network.
How long is data retained?
Retention depends on your plan. Enterprise deployments can use custom retention policies based on your needs.
What alerts can I create?
Create alerts for pipeline failure spikes, lead time increases, longer queues, or throughput drops — and deliver notifications via Webhook, Telegram, or Slack.
Is there an Enterprise option?
Yes. Watchlog can run on a dedicated server with your domain and branding. Your data stays on your infrastructure and public registration can be disabled.