Why is this broken?
WatchLog answers in one sentence. For an alert, a failing connection, or a pod or container that keeps crashing, it names the likely cause and shows the evidence that leads there, on Kubernetes and Docker.
Read the probable cause docs →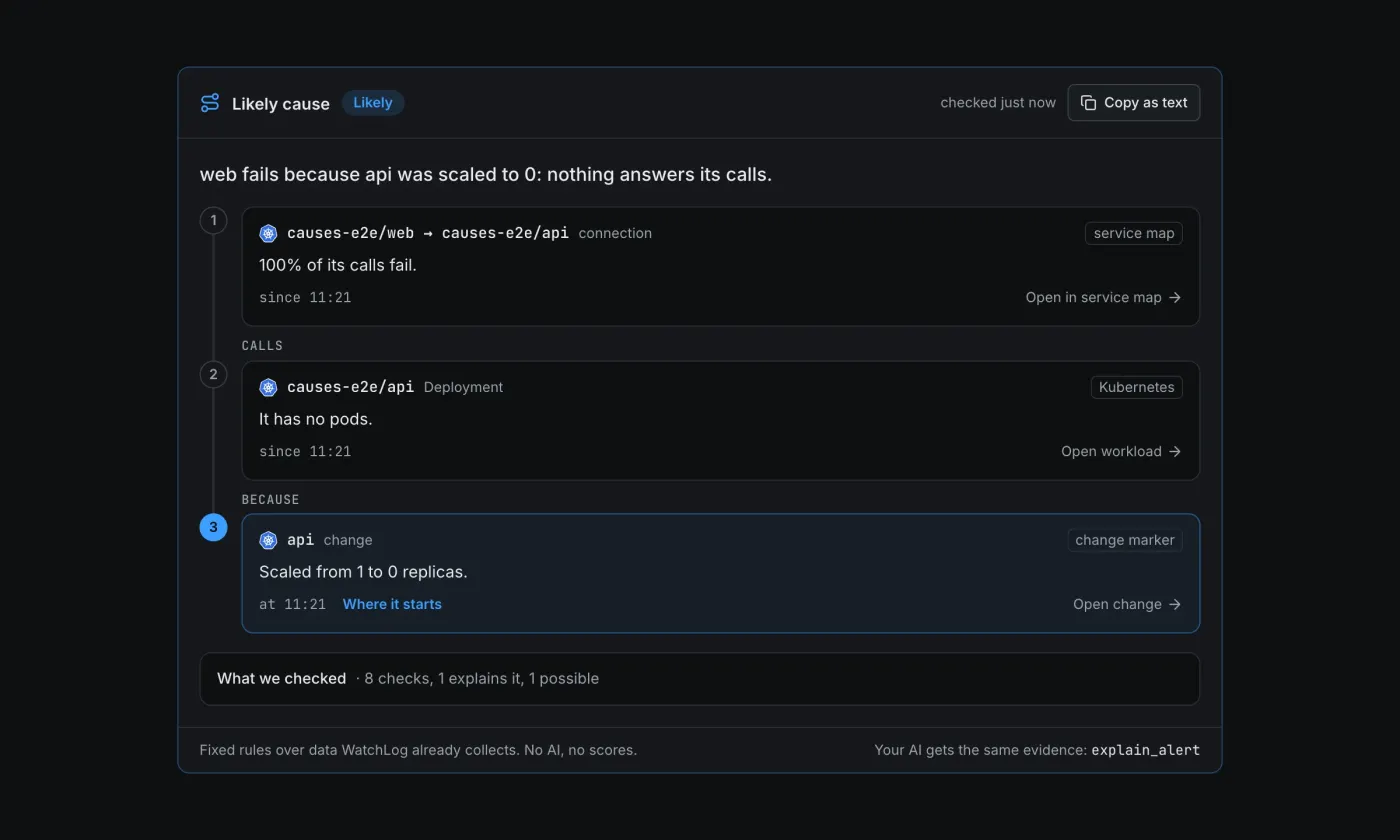
A sentence, then the evidence
The answer starts with what is wrong and why. Under it, the chain of facts that leads there, the symptom first, each step with its time and a link to the object, down to where it starts.
 Kubernetes
Likely frontend fails because api was scaled to 0: nothing answers its calls.
- shop/frontend → shop/apiservice map100% of its calls fail.↓ calls
- shop/apiKubernetesIt has no pods.↓ because
- apichange markerScaled from 2 to 0 replicas.
 Docker
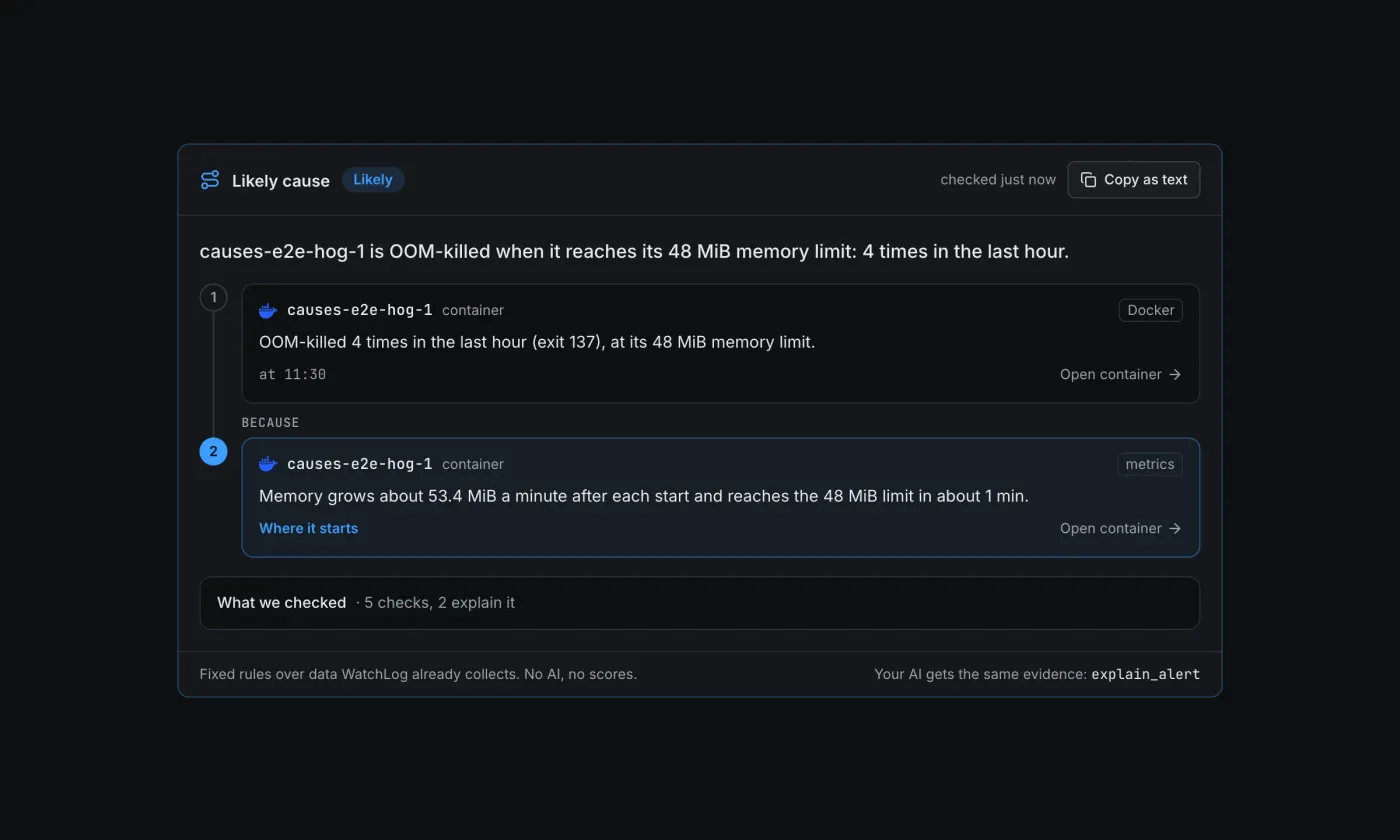
Likely shop-worker-1 is OOM-killed when it reaches its 256 MiB memory limit: 12 times in the last hour.
- shop-worker-1DockerOOM-killed 12 times in the last hour (exit 137), at its 256 MiB memory limit.↓ because
- shop-worker-1metricsMemory grows about 50 MiB a minute after each start and reaches the 256 MiB limit in about 5 min.
Examples written with the product's own sentences. In the dashboard, "Copy as text" puts an answer on your clipboard, for a ticket or an AI chat.
Likely, possible, or no clear cause
How sure WatchLog is, said in words. There is no percentage and no score anywhere: in the dashboard, the API or MCP, a number would suggest a precision the rules don't have.
- Likely
One rule matched with a complete chain of evidence, and the cause began before the problem, or with it. At most one cause is likely, and only a likely cause goes into your alerts.
frontend fails because api was scaled to 0: nothing answers its calls.
- Possible
The chain is partial, the cause began after the problem, or two causes are as strong as each other. You see each of them, as leads to check.
Nothing proves one cause for frontend. These 2 could explain it.
- No clear cause
No rule matched. WatchLog lists what it checked, from the object and its events to the node or host and the services it calls, and what it found, so you start from facts, not from a blank page.
We checked 6 things around api and none of them explains it. Nothing changed in the 60 minutes before.
Twelve rules, on Kubernetes and Docker
WatchLog checks the same list every time, in this order, which also breaks a tie. Each rule has a Docker form in Docker's words, except three that only exist on Kubernetes: it can't pull its image, no node takes it, a Job that failed.
- 01A service it calls is downThe workload it calls has no ready pods: scaled to 0, or every pod failing.The container it calls stopped or exited, or a Compose service has nothing running.
- 02A change that went wrongA rollout or image change shortly before, and the new version crashes, runs out of memory, or makes its callers slow or fail with 5xx.The container re-created, a new image or a Compose change, with the same signs.
- 03Out of memory at its limitOOMKilled at its memory limit, with the kills in the last hour, and the memory climbing after each start when the data shows it.The oom event and exit 137, against the container's memory limit.
- 04It crashesIt keeps exiting with a code (CrashLoopBackOff), with its last warning.It exits with a code and its restart policy brings it back, or it exits and stays stopped.
- 05It can't pull its imageKubernetes onlyImagePullBackOff: a tag that doesn't exist, a registry that refuses access or can't be reached.Kubernetes only: on Docker a pull that fails stops at docker compose up, on your terminal, and no container ever starts.
- 06No node takes itKubernetes onlyFailedScheduling, with the reason: the CPU or memory it asks for, taints, a node selector, cordoned nodes.Kubernetes only: Docker has no scheduler.
- 07The node or host under itA node NotReady, under memory or disk pressure, or cordoned; pods evicted or OOM-killed because the node ran out.The host went silent, its memory or disk is nearly full, or a container is OOM-killed because the host ran out.
- 08A problem on a service it usesA monitored Redis, PostgreSQL, Nginx or RabbitMQ has a problem, followed to who causes it: PostgreSQL near max_connections and the workload holding them, a queue filling up because its consumer is down.The same, for the services on your Docker hosts.
- 09Nothing accepts its connectionsThe service it calls runs, but nothing accepts connections on that port.The same, between containers.
- 10A name that doesn't existIts lookups get NXDOMAIN (no such name); search-path misses don't count.The same, from the container's lookups.
- 11CPU-throttled at its limitThrottled 25% of the time or more at its CPU limit, while the calls to it slow down.The same, for a container with a CPU limit.
- 12A Job that failedKubernetes onlyA Job or CronJob run failed: its pods' exit code, and the back-off limit or deadline it reached.Kubernetes only: Docker has no Jobs. A one-off container that fails is a crash.
When the object's own facts don't explain it, WatchLog follows the connections that fail or slow down, up to two services away, and asks the same rules there. Without network flows it can't, and the answer says so.
Wherever you look
- The alertAbove its chart, with the moments of the chain marked on it.
- Needs attentionOne line under each problem on the overview: Likely, Possible or No clear cause.
- Pods and workloadsNext to a pod's last termination, and above a workload's pods.
- Containers and Compose servicesUnder the diagnosis on a container's page, and above a Compose service's containers.
- The service mapA short form in the panel of a failing or slow connection.
- ApplicationsBeside a Redis, PostgreSQL, Nginx or RabbitMQ problem.
In the alert itself
When an alert fires with a likely cause, the message to Slack, Telegram or email gets one more line, and the resolve message repeats it as "Was likely". A possible cause or no clear cause adds nothing, and a message never waits more than 2 seconds for it.
Webhooks get the same as likelyCause on each alert: the rule, its facts, the sentence, and the evidence chain.
WARNING · frontend cannot reach api
100% of connections failed · threshold 5%
shop/frontend (Deployment) · cluster prod · since 10:02 UTC (5 min)
Likely cause: frontend fails because api was scaled to 0: nothing answers its calls.
"likelyCause": {
  "rule": "dependency_down",
  "headline": { "code": "dependency_down_scaled", "facts": { … } },
  "text": "frontend fails because api was scaled to 0: nothing answers its calls.",
  "subject": "alert:…",
  "chain": [ … ]
}Ask your AI why
Claude and ChatGPT get the same answer through WatchLog's MCP server, read-only. explain_problem explains a workload, pod, container, Compose service, connection or monitored service; explain_alert carries an alert's causes; and get_problems gives each problem its likely cause.
The answers are codes and facts, with each rule's meaning in a sentence: your assistant writes the words, and treats "possible" as a lead to check.
Connect your assistant →Why is shop/frontend failing?
get_problems · explain_problem
WatchLog's likely cause: api was scaled from 2 to 0 replicas at 10:01, so nothing answers frontend's calls; 100% of them fail since 10:02. Scale shop/api back up, then check what scaled it down.
No AI in the product, no scores
- Fixed rules over data WatchLog already collects: restarts and exit codes, events, recent changes, the node or host, the service map and your applications. No new agent and no extra probe.
- No model runs inside WatchLog. The same facts give the same answer, every time.
- Every answer shows its evidence and what was checked, so you can see why, and when it's wrong.
- It works on the history you keep (15 days by default), so last week's alert can still be explained.
- In every edition, Community included.