
MySQL and MariaDB monitoring for Kubernetes and Docker
Lock waits name the session holding the lock. Connections against the limit, slow statements, InnoDB and replication too, explained in plain words, with the workloads and containers that use the database.
MySQL 8.0 and later, MariaDB 10.6 and later, and Percona Server
Read the MySQL and MariaDB docs →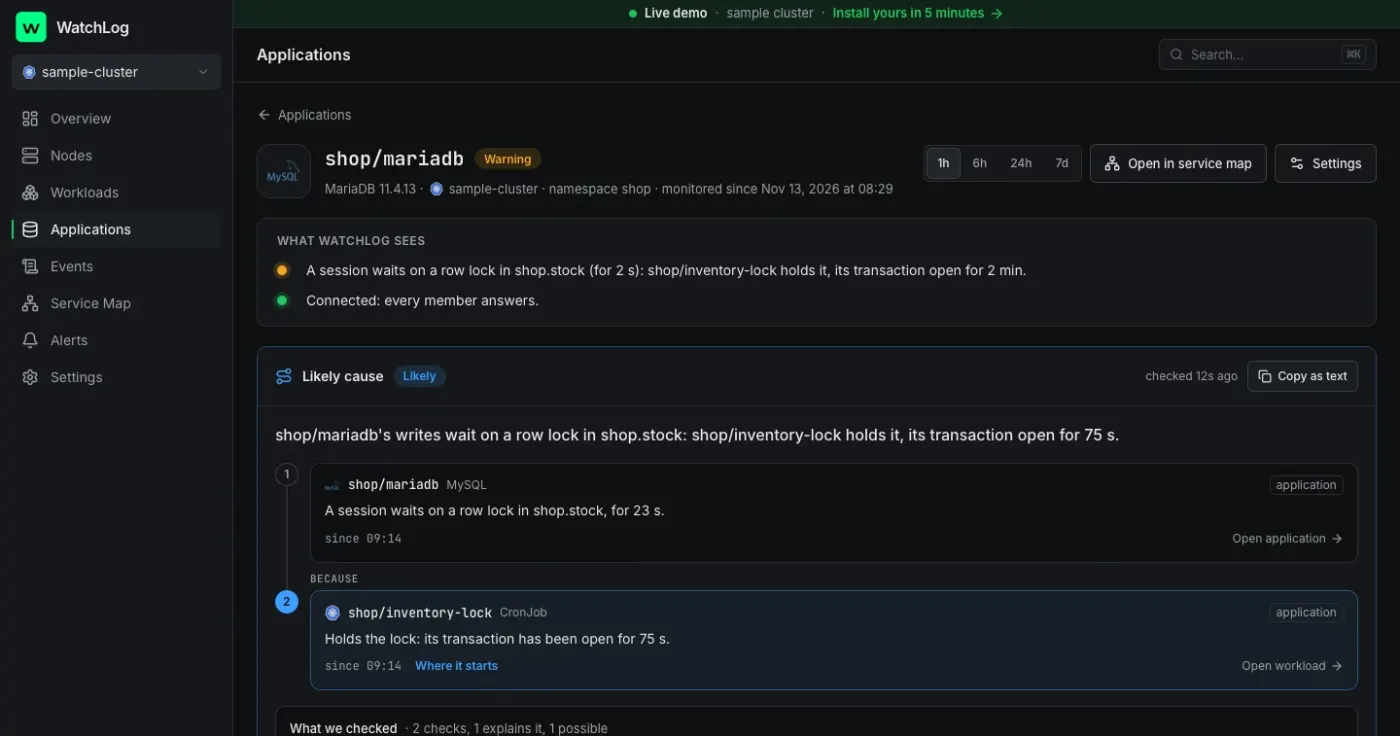
Everything on one page, in six tabs
- OverviewConnections against max_connections, queries and slow queries per second, buffer pool hit, replication lag, the longest running query and the slowest statements.
- ConnectionsThreads connected and running, connections by client workload or container, and aborted and refused connections.
- QueriesRows read and written per second, statement latency, temporary tables on disk, full scans and the top statements by total time.
- LocksRow lock waits, and who blocks whom right now: the waiting client, the table, how long, and the client whose transaction holds the lock. Deadlocks too.
- InnoDB and storageThe buffer pool's data and dirty pages, reads from disk, redo written and the largest tables.
- ReplicationThe replica's IO and SQL threads, their last error, and lag.
Problems it explains
- Lock waits, with the session holding the lock: its workload or container, the table, and how long its transaction has been open
- Connections near max_connections, with the clients holding most, and connections refused at the limit
- A query running over 5 minutes, and deadlocks
- Replication stopped or behind
- A low buffer pool hit, and many temporary tables on disk
- performance_schema off (MariaDB has it off), with the setting
Alerts on from day one
- Connections above 90% of max_connections for 5 minutes
- A query running longer than 5 minutes
- Replication stopped: the IO or SQL thread not running
- Replication lag above 30 seconds for 2 minutes
- Deadlocks detected
- The service unreachable, or slow to connect
To Slack, Telegram, email or a webhook. You choose which start on when you connect, and change any of them in the rule editor.
Set up in one command
WatchLog writes this command with a new password; it asks for the root password at the prompt. The same command works on MySQL and MariaDB. The user reads statistics, never table data, and every session WatchLog opens is read-only. Prefer an existing user, a Kubernetes Secret or a file on the Docker host? That works too.
Statement text is the server's digest, with every value already replaced by ?. MariaDB has performance_schema off: the page says how to turn it on for the statement tables.
Every option in the docs →kubectl exec -it -n shop statefulset/mysql -- sh -c 'exec "$(command -v mariadb || command -v mysql)" -uroot -p -e "$0"' \ 'CREATE USER `watchlog`@`%` IDENTIFIED BY "…" WITH MAX_USER_CONNECTIONS 2; GRANT PROCESS, REPLICATION CLIENT /*M!100509 , SLAVE MONITOR */ ON *.* TO `watchlog`@`%`; GRANT SELECT ON performance_schema.* TO `watchlog`@`%`; GRANT SELECT ON mysql.innodb_table_stats TO `watchlog`@`%`'
docker exec -it shop-mysql-1 sh -c 'exec "$(command -v mariadb || command -v mysql)" -uroot -p -e "$0"' \
  'CREATE USER `watchlog`@`%` IDENTIFIED BY "…" WITH MAX_USER_CONNECTIONS 2;
  GRANT PROCESS, REPLICATION CLIENT /*M!100509 , SLAVE MONITOR */ ON *.* TO `watchlog`@`%`;
  GRANT SELECT ON performance_schema.* TO `watchlog`@`%`;
  GRANT SELECT ON mysql.innodb_table_stats TO `watchlog`@`%`'
Docker hosts also run the integrations collector: the service page gives its docker run command. On Kubernetes the chart already runs it.
Ask your AI about MySQL and MariaDB
Claude and ChatGPT read the same facts through WatchLog's MCP server, read-only: the service's health, every reason, and the workloads or containers that connect to it.
Connect your assistant →Why are stock updates hanging?
get_application · explain_problem
Writes to shop.stock wait on a row lock. shop/inventory-sync holds it: its transaction has been open for 4 minutes.
 Redis
 PostgreSQL
 MongoDB
 Nginx
 Traefik
 RabbitMQ
 Kafka