
Redis monitoring for Kubernetes and Docker
Memory against maxmemory, evictions, slow commands and blocked clients, explained in plain words, with the workloads and containers that connect. Valkey too.
Redis 6.2 and later, and Valkey
Read the Redis docs →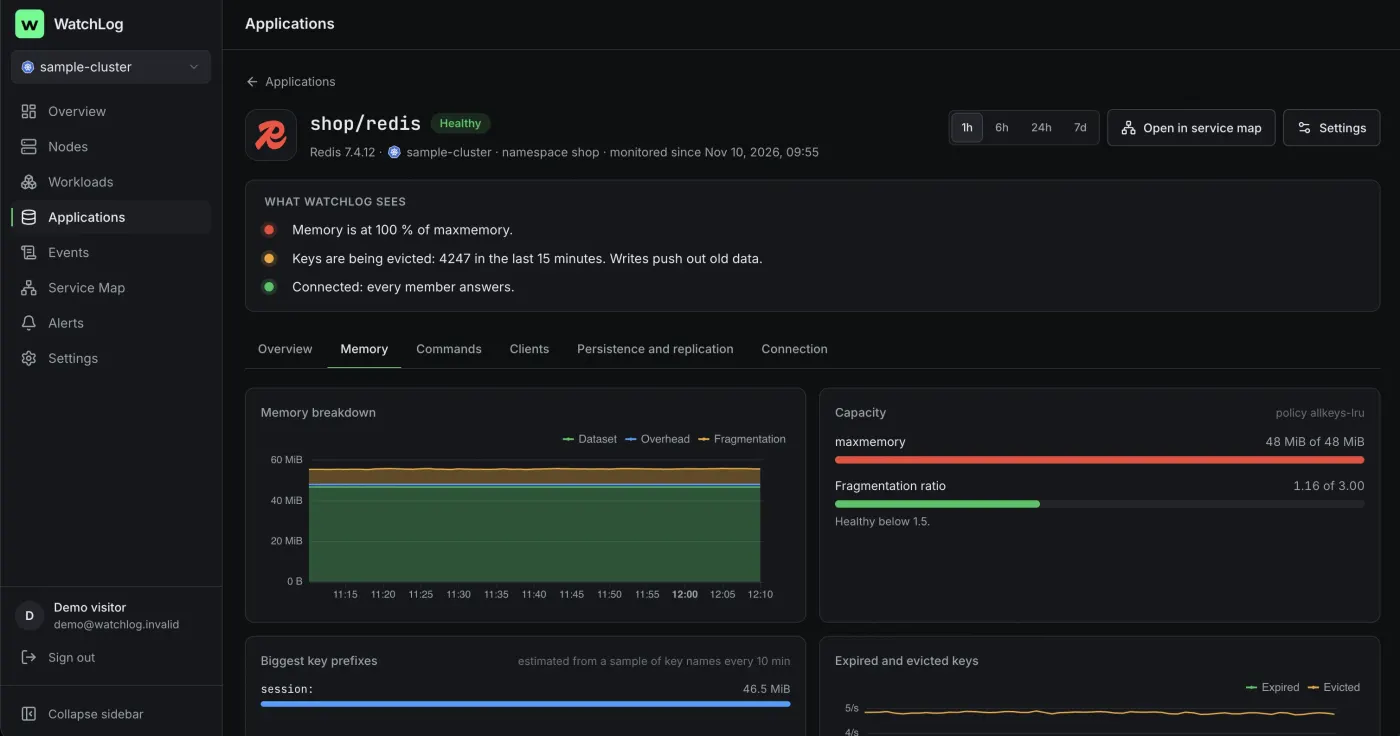
Everything on one page, in five tabs
- OverviewMemory against maxmemory, hit rate, commands per second, clients, keys evicted in 24 hours and the slow log.
- MemoryDataset, overhead and fragmentation, the eviction policy, and the biggest key prefixes from a sample of key names.
- CommandsCalls per second by command, the slowest commands, and the latency histogram on Redis 7.
- ClientsConnected and blocked clients, by workload or container, against maxclients.
- Persistence and replicationThe last RDB save and AOF status, the replica state, and how many bytes each replica is behind.
Problems it explains
- Memory near maxmemory, and keys being evicted
- No maxmemory set, so memory grows until the container's limit
- KEYS in the slow log
- A replica disconnected, or a failed save
- Connections refused at maxclients, and blocked clients
Alerts on from day one
- Memory above 90 % of maxmemory for 5 minutes
- Keys are being evicted
- A replica disconnected
- The last RDB or AOF save failed
- Clients blocked for 2 minutes
- The service unreachable, or slow to connect
To Slack, Telegram, email or a webhook. You choose which start on when you connect, and change any of them in the rule editor.
Set up in one command, or none
Without a password there is nothing to set up. Otherwise WatchLog writes this command with a new password for a read-only user. Prefer an existing user, a Kubernetes Secret or a file on the Docker host? That works too.
WatchLog sees key names for the biggest-prefixes panel and never reads a value.
Every option in the docs →kubectl exec -n shop statefulset/redis -- redis-cli ACL SETUSER watchlog reset on '>…' '~*' \ +info +ping +slowlog +latency '+config|get' '+client|list' '+memory|stats' '+memory|usage' +scan
docker exec shop-redis-1 redis-cli ACL SETUSER watchlog reset on '>…' '~*' \
  +info +ping +slowlog +latency '+config|get' '+client|list' '+memory|stats' '+memory|usage' +scan
Docker hosts also run the integrations collector: the service page gives its docker run command. On Kubernetes the chart already runs it.
Ask your AI about Redis
Claude and ChatGPT read the same facts through WatchLog's MCP server, read-only: the service's health, every reason, and the workloads or containers that connect to it.
Connect your assistant →Why is the storefront slow?
list_applications · get_application
storefront/cache is at 97 % of maxmemory and evicting keys, and KEYS shows up in its slow log. Raise maxmemory or add TTLs, and replace KEYS with SCAN.
 PostgreSQL
 Nginx
 RabbitMQ