
Kafka monitoring for Kubernetes and Docker
The consumer group that lost its members, and why they left: OOM-killed, crash-looping, exited or gone. Brokers, partitions and lag per topic too, read-only through the Kafka protocol, with no JMX.
Kafka 3.0 and later, KRaft or ZooKeeper
Read the Kafka docs →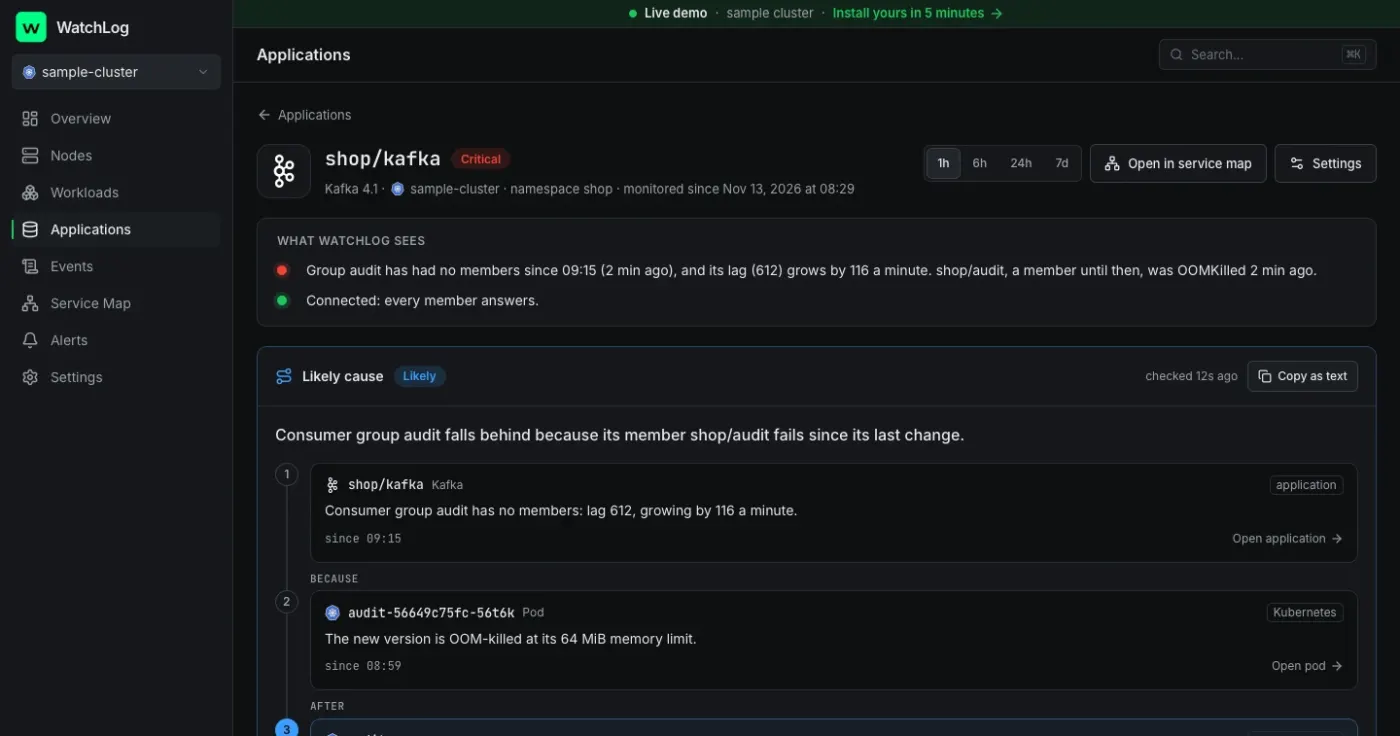
Everything on one page, in five tabs
- OverviewBrokers up, offline and under-replicated partitions, messages in per second, consumer groups and the largest lag, and the groups with their state, members and lag.
- TopicsThe largest and busiest topics, and every topic with its partitions, replication factor, retention and size.
- Consumer groupsLag per group and topic, messages consumed per second, and the members with the workload or container they run in.
- BrokersEach broker: host, rack, controller and reachable, the KRaft quorum, partitions, leaders and log size.
- Broker internalsBytes in and out and requests per second, when your brokers already expose a Prometheus endpoint.
Problems it explains
- A consumer group that lost its members while its lag grows, and how the member ended: OOM-killed, crash-looping, exited or gone
- Offline partitions, with the topic
- Under-replicated partitions, with the topic
- A broker gone from the cluster
- A group whose lag keeps growing although it has members
Kafka says which host each member connected from; WatchLog maps that address to a workload or container. When it is no longer known, the clients that ended since stand in, as for RabbitMQ.
Alerts on from day one
- Offline partitions for a minute
- Under-replicated partitions for 5 minutes
- A broker down for a minute
- A group's lag grows for 10 minutes
- A group lost its members while its lag grows
- The service unreachable, or slow to connect
To Slack, Telegram, email or a webhook. You choose which start on when you connect, and change any of them in the rule editor.
Nothing to set up on PLAINTEXT
On a PLAINTEXT listener there is nothing to set up. With SASL, WatchLog writes these commands with a new password: a SCRAM user that may only describe the cluster, topics and groups. It reads through the admin API, the way a client does, and never your messages. Prefer an existing user, a Kubernetes Secret or a file on the Docker host? That works too.
The apache/kafka-native image has no tools: run them from an apache/kafka container on the same network.
Every option in the docs →kubectl exec -it -n shop statefulset/kafka -- /opt/kafka/bin/kafka-configs.sh \ --bootstrap-server localhost:9092 --alter --entity-type users --entity-name watchlog \ --add-config 'SCRAM-SHA-512=[password=…]' kubectl exec -it -n shop statefulset/kafka -- /opt/kafka/bin/kafka-acls.sh \ --bootstrap-server localhost:9092 --add --allow-principal User:watchlog \ --operation Describe --cluster --topic '*' --group '*' kubectl exec -it -n shop statefulset/kafka -- /opt/kafka/bin/kafka-acls.sh \ --bootstrap-server localhost:9092 --add --allow-principal User:watchlog \ --operation DescribeConfigs --topic '*'
docker exec -it shop-kafka-1 /opt/kafka/bin/kafka-configs.sh \
  --bootstrap-server localhost:9092 --alter --entity-type users --entity-name watchlog \
  --add-config 'SCRAM-SHA-512=[password=…]'
docker exec -it shop-kafka-1 /opt/kafka/bin/kafka-acls.sh \
  --bootstrap-server localhost:9092 --add --allow-principal User:watchlog \
  --operation Describe --cluster --topic '*' --group '*'
docker exec -it shop-kafka-1 /opt/kafka/bin/kafka-acls.sh \
  --bootstrap-server localhost:9092 --add --allow-principal User:watchlog \
  --operation DescribeConfigs --topic '*'
Docker hosts also run the integrations collector: the service page gives its docker run command. On Kubernetes the chart already runs it.
Ask your AI about Kafka
Claude and ChatGPT read the same facts through WatchLog's MCP server, read-only: the service's health, every reason, and the workloads or containers that connect to it.
Connect your assistant →Why has the audit log stopped updating?
get_application · explain_problem
Consumer group audit has had no members for 6 minutes and its lag grows by 116 a minute. Its member shop/audit was OOM-killed at its 64 MiB memory limit.
 Redis
 PostgreSQL
 MySQL and MariaDB
 MongoDB
 Nginx
 Traefik
 RabbitMQ