
PostgreSQL monitoring for Kubernetes and Docker
Slow queries, who blocks whom, connections against the limit, replication and vacuum, explained in plain words, with the workloads and containers that use the database.
PostgreSQL 12 and later
Read the PostgreSQL docs →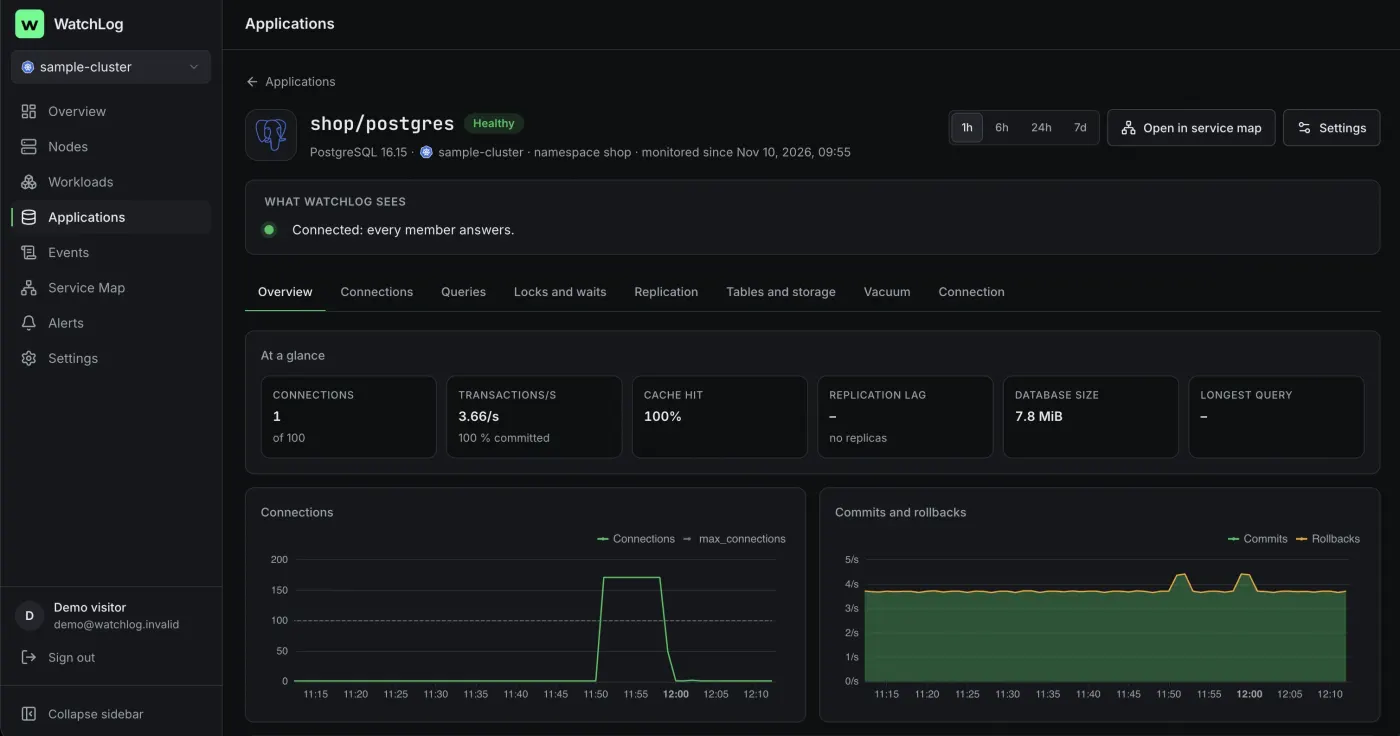
Everything on one page, in seven tabs
- OverviewConnections against max_connections, transactions per second, cache hit, replication lag, database size and growth, and the slowest queries.
- ConnectionsBackends by state, and connections by client workload or container, against the limits.
- QueriesRows read and written per second, statement durations, temporary files and the top queries by total time.
- Locks and waitsWhat sessions wait on, who blocks whom right now and for how long, and deadlocks.
- ReplicationReplay lag per replica, pg_wal against max_wal_size, and replication slots.
- Tables and storageThe largest tables, estimated bloat and indexes never used.
- VacuumTables waiting for vacuum, dead rows, and transaction ID age against the 2,000 M limit.
Problems it explains
- Connections near max_connections, with the workloads holding most
- A query running over 5 minutes, and sessions idle in a transaction
- Lock waits, with the blocking client's workload, and deadlocks
- A replica behind, or an inactive replication slot keeping WAL
- Transaction ID wraparound risk, and autovacuum not finishing on a table
- A low cache hit, and pg_stat_statements missing
Alerts on from day one
- Connections above 90 % of max_connections for 5 minutes
- A query running longer than 5 minutes
- Replication lag above 30 seconds for 2 minutes
- Transaction ID age above 1,500 M
- Deadlocks detected
- The service unreachable, or slow to connect
To Slack, Telegram, email or a webhook. You choose which start on when you connect, and change any of them in the rule editor.
Set up in one command
WatchLog writes this command with a new password. The pg_monitor role reads statistics, never your tables, and every session WatchLog opens is read-only. Prefer an existing role, a Kubernetes Secret or a file on the Docker host? That works too.
The query tables need the pg_stat_statements extension. Query text is stored normalised ($1, $2, …), never with values.
Every option in the docs →kubectl exec -n shop statefulset/postgres -- psql -U postgres -v ON_ERROR_STOP=1 \ -c "CREATE ROLE watchlog LOGIN PASSWORD '…'" -c "GRANT pg_monitor TO watchlog"
docker exec shop-postgres-1 psql -U postgres -v ON_ERROR_STOP=1 \
  -c "CREATE ROLE watchlog LOGIN PASSWORD '…'" -c "GRANT pg_monitor TO watchlog"
Docker hosts also run the integrations collector: the service page gives its docker run command. On Kubernetes the chart already runs it.
Ask your AI about PostgreSQL
Claude and ChatGPT read the same facts through WatchLog's MCP server, read-only: the service's health, every reason, and the workloads or containers that connect to it.
Connect your assistant →Why is checkout slow right now?
get_application · get_service_map
A session idle in a transaction from payments/worker holds a lock on payments; two queries have waited 38 s behind it.
 Redis
 Nginx
 RabbitMQ