
MongoDB monitoring for Kubernetes and Docker
Slow collection scans name the client that sends them. Replica set members and lag, connections against the limit and the WiredTiger cache too, explained in plain words.
MongoDB 6.0 and later, standalone or a replica set
Read the MongoDB docs →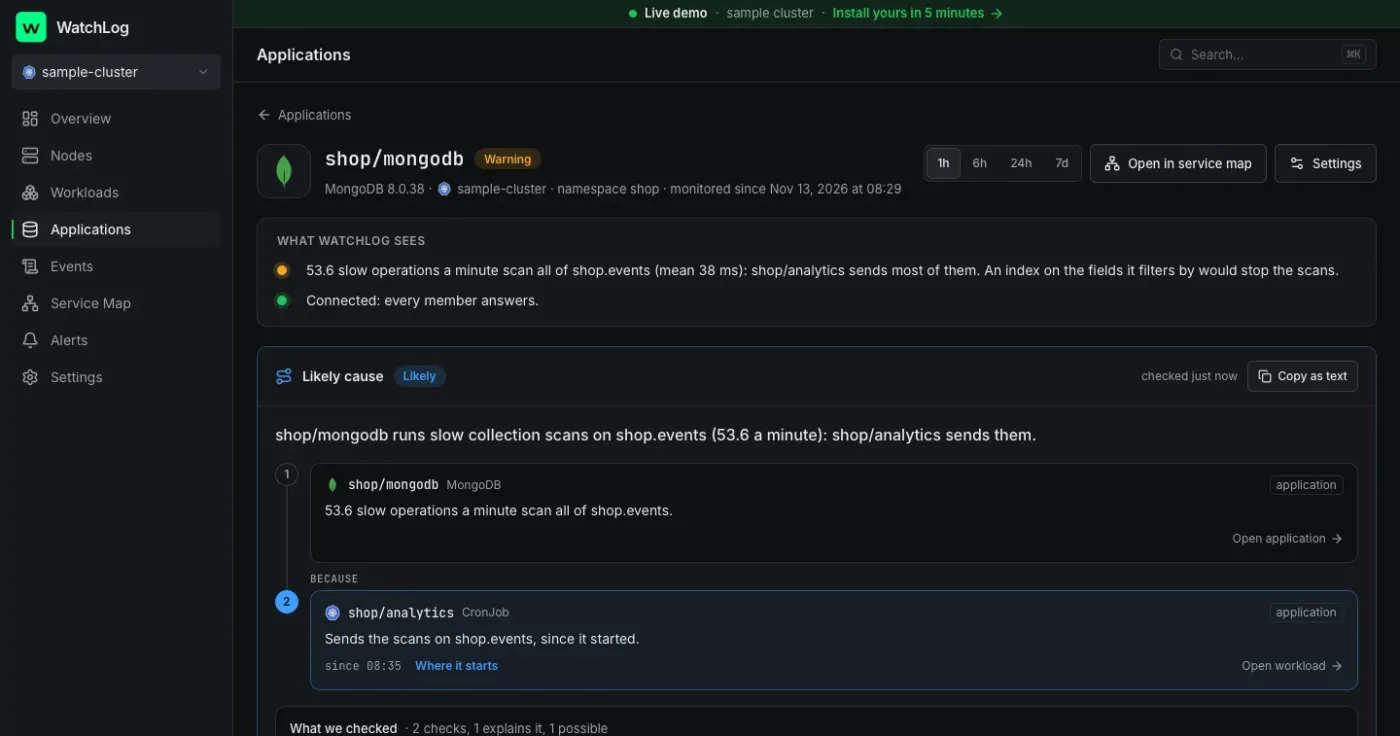
Everything on one page, in three tabs
- OverviewOperations per second, connections against the limit, replication lag, slow operations in the last hour, the WiredTiger cache, the oplog window and the replica set's members.
- OperationsOperation latency, the busiest collections, and recent slow operations: shape, collection, plan (collection scans marked) and the workload or container that sent them.
- Cache and storageThe WiredTiger cache and the disk, read and write tickets, the largest collections and indexes never used.
Problems it explains
- Slow collection scans, with the client that sends them: its workload or container, the collection, how many a minute
- No primary, a member down, or a secondary behind
- Connections near the limit, with the clients holding most
- The WiredTiger cache under pressure, and operations queued for a ticket
- An oplog too short to ride out a secondary's day off
Alerts on from day one
- The replica set has no primary for a minute
- Replication lag above 30 seconds for 2 minutes
- A replica set member down for a minute
- More than 20 slow operations a minute for 5 minutes
- The oplog window under 24 hours, once the oplog is full
- The service unreachable, or slow to connect
To Slack, Telegram, email or a webhook. You choose which start on when you connect, and change any of them in the rule editor.
Set up in one command
WatchLog writes this command with a new password; it asks for the admin's password at the prompt. clusterMonitor reads statistics, never your documents. On a replica set, run it once, against the primary. Prefer an existing user, a Kubernetes Secret or a file on the Docker host? That works too.
Slow operations are kept as their shape: field names and operators, with every value replaced by ?.
Every option in the docs →kubectl exec -it -n shop statefulset/mongo -- mongosh -u root -p --authenticationDatabase admin --quiet \
--eval 'db.getSiblingDB("admin").createUser({ user: "watchlog", pwd: "…", roles: [{ role: "clusterMonitor", db: "admin" }] })'docker exec -it shop-mongo-1 mongosh -u root -p --authenticationDatabase admin --quiet \
--eval 'db.getSiblingDB("admin").createUser({ user: "watchlog", pwd: "…", roles: [{ role: "clusterMonitor", db: "admin" }] })'Docker hosts also run the integrations collector: the service page gives its docker run command. On Kubernetes the chart already runs it.
Ask your AI about MongoDB
Claude and ChatGPT read the same facts through WatchLog's MCP server, read-only: the service's health, every reason, and the workloads or containers that connect to it.
Connect your assistant →Why is the reports page slow?
get_application · explain_problem
shop/mongo runs about 290 slow collection scans a minute on shop.events, all sent by shop-analytics-1. An index on the fields it filters by would stop them.
 Redis
 PostgreSQL
 MySQL and MariaDB
 Nginx
 Traefik
 RabbitMQ
 Kafka