
Traefik monitoring for Kubernetes and Docker
The requests Traefik answers itself, and the backend that has no server up. Requests, 5xx and latency per service and entrypoint, TLS included, on k3s's default ingress and on Docker.
Traefik 2.10 and later, and 3.x; k3s's bundled Traefik too
Read the Traefik docs →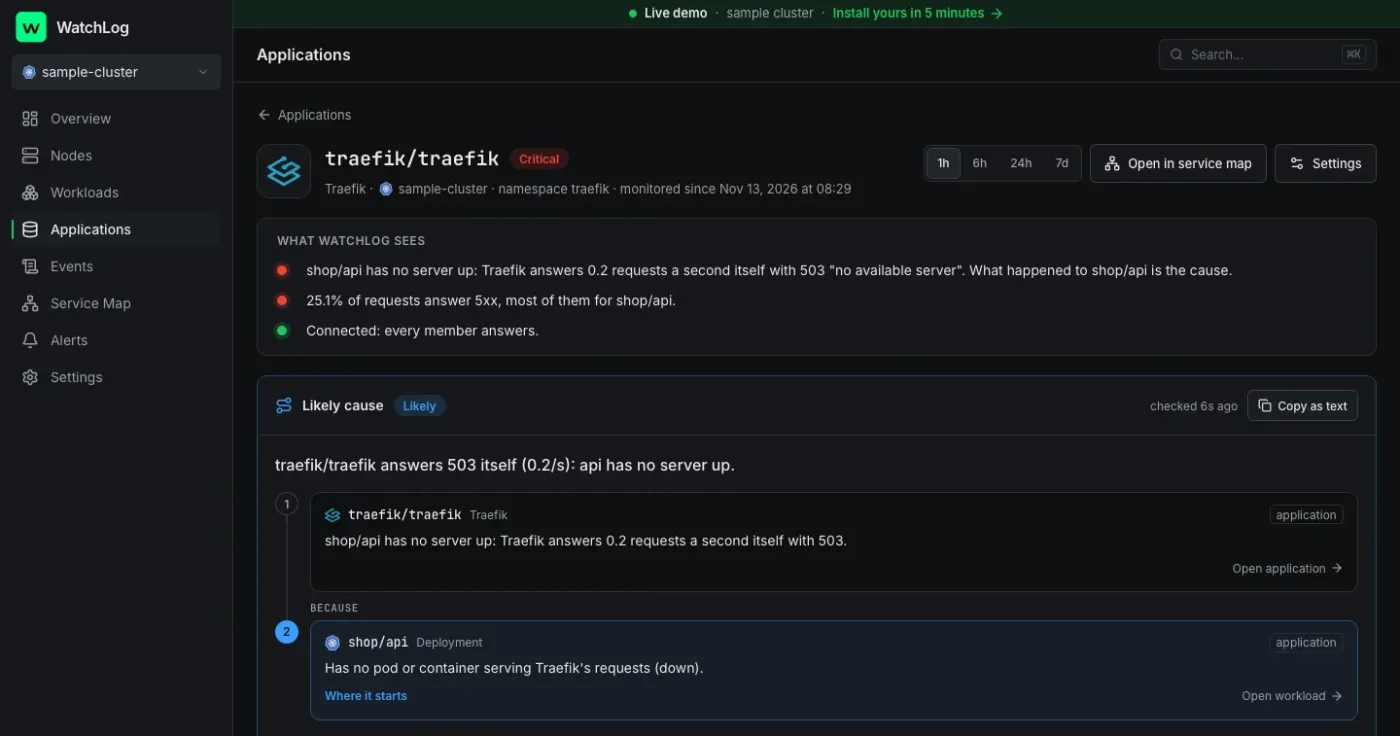
Everything on one page, in three tabs
- OverviewRequests per second, the 5xx share, p50 and p95, open connections, services with a server up, the soonest certificate expiry and the busiest services.
- ServicesEach service with its backend workload or container: requests, 5xx share, p95, servers up and retries.
- Entrypoints and TLSRequests and connections by entrypoint, which carry TLS, your certificates and when each expires, and configuration reloads.
Problems it explains
- A service with no server up, with its backend and why: scaled to 0, crashing or out of memory
- The 5xx share, with the service that sends most of them and its workload's last rollout
- A high p95
- A certificate that expires within 14 days
- A failed configuration reload (Traefik 2)
- Metrics off, with the setting for k3s, Helm or Docker
On the service map, Traefik adds what eBPF can't see: its numbers on TLS or HTTP/2 edges to a backend, and the requests it answered itself. No request is counted twice.
Alerts on from day one
- More than 5 % of requests answer 5xx for 5 minutes
- p95 above 1 s for 5 minutes
- A service with no server up for a minute
- A certificate expires within 14 days
- The last configuration reload failed (Traefik 2)
- The service unreachable, or slow to connect
To Slack, Telegram, email or a webhook. You choose which start on when you connect, and change any of them in the rule editor.
Nothing to set up
WatchLog reads Traefik's own Prometheus metrics, on by default in k3s's bundled Traefik and in Traefik's Helm chart (port 9100). No user, no password, and it never collects request paths or hosts. If the metrics are off, the page gives the setting for your install:
Docker 29 needs Traefik 3.6.1 or later: older versions' Docker provider routes nothing there.
Every option in the docs →# Traefik's Helm chart (k3s: a HelmChartConfig, in the docs)
helm upgrade <release> traefik/traefik -n <namespace> --reuse-values \
--set metrics.prometheus.entryPoint=metrics# Three flags on the Traefik container
--entrypoints.metrics.address=:9100
--metrics.prometheus=true
--metrics.prometheus.entrypoint=metricsDocker hosts also run the integrations collector: the service page gives its docker run command. On Kubernetes the chart already runs it.
Ask your AI about Traefik
Claude and ChatGPT read the same facts through WatchLog's MCP server, read-only: the service's health, every reason, and the workloads or containers that connect to it.
Connect your assistant →Why does the shop answer 503?
get_application · explain_problem
traefik/traefik answers the 503s itself: shop/api has no server up. Its Deployment was scaled to 0 at 10:00.
 Redis
 PostgreSQL
 MySQL and MariaDB
 MongoDB
 Nginx
 RabbitMQ
 Kafka