PostgreSQL Monitoring with Watchlog – Real-Time Insights, Total Control
Monitoring Tool
🎯 What Can You Monitor?
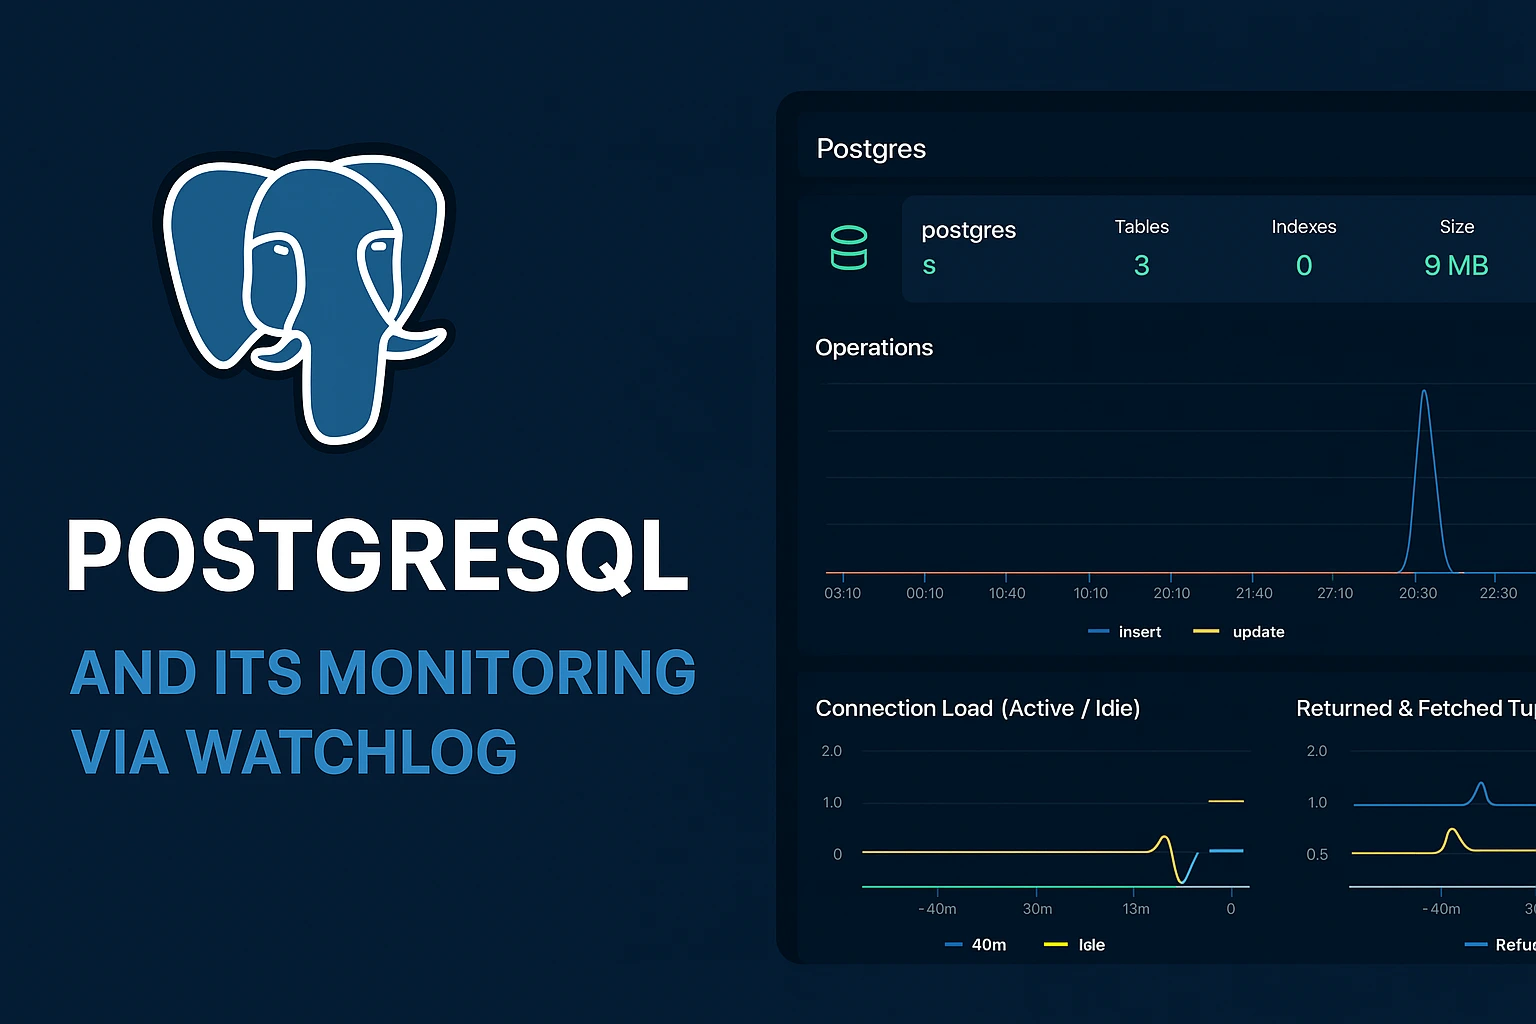
✅ Database Overview
- Tables count
- Indexes count
- Total database size
- Uptime since last restart
This gives you a quick and clear snapshot of your PostgreSQL instance health.

📈 Database Operations (Insert / Update / Delete)
View live metrics on:
- Records inserted
- Records updated
- Records deleted
Useful for identifying peak times, abnormal activity, or application behavior patterns.
🔌 Connection Load
Track the number of:
- Active connections
- Idle connections
Identify connection bottlenecks or overloaded instances instantly.
🧠 Cache & Disk Blocks
- Cache Hit Rate (%): Shows how efficiently the cache is being used
- Disk Read vs Cache Hit: Compare how many blocks are read from disk vs served from cache
Helps optimize memory usage and minimize I/O overhead.
🔒 Lock & Query Analysis
- Active vs Waiting Locks: Monitor locks in use vs those waiting
- Blocked Queries: Identify queries held back due to resource contention
- Deadlocks: Track deadlock incidents and prevent system freeze-ups
🔁 Transaction Outcomes
Monitor the balance between:
- Committed transactions
- Rolled back transactions
A great way to evaluate system stability and application logic correctness.
📦 Returned vs Fetched Tuples
Understand how much data is being pulled vs actually returned by queries. Great for identifying inefficient queries and unused results.

Query Performance Insights
The Normalized Query section groups and simplifies queries to give you an aggregated view with key metrics like:
- Count: How many times each query was executed
- Total Duration: Cumulative execution time of the query
- Avg Duration: Average time per execution
- Avg Rows: Average number of rows returned
For example, the query select * from users was executed 40 times with negligible average duration and returned an average of 5 rows, suggesting it’s lightweight but frequently called.

❓ Frequently Asked Questions (FAQ)
How can I monitor PostgreSQL with Watchlog?
Simply install the Watchlog Agent and enable PostgreSQL integration in the integration.json file. Metrics will appear automatically on the dashboard.
Can I monitor multiple PostgreSQL databases?
Yes, you can monitor one or more databases simultaneously by listing them in the config file.
Is Watchlog free?
The core version of Watchlog is free. Advanced features and dedicated deployments are available in the Enterprise edition.